posted by Spencer Parkinson on Thursday, February 23, 2017
Carl Zulauf and Gary Schnitkey recently published a brief research paper in Farmdoc Daily (FDD) in which they studied the loss ratio of all major insured crops and then individually for each of the four crops. These crops included corn, soybeans, cotton and wheat.
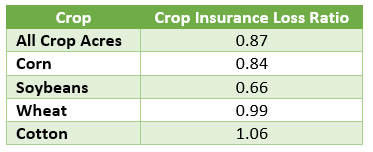
Their results suggest that, in the aggregate, all crops are below the loss ratio objective of 1.0. This implies that total premiums are greater than total indemnities over time. However, while they found that corn, soybeans and wheat were below the loss ratio objective, they also found that cotton did exceed the loss ratio objective, on average, from 2001-15. Below are summary results from the FDD analysis:
Given the national variability in weather, crop insurance purchase patterns (plan, coverage level, etc.) the application of the analysis to Iowa makes sense. This analysis follows.
Historical Crop Insurance Purchase Patterns
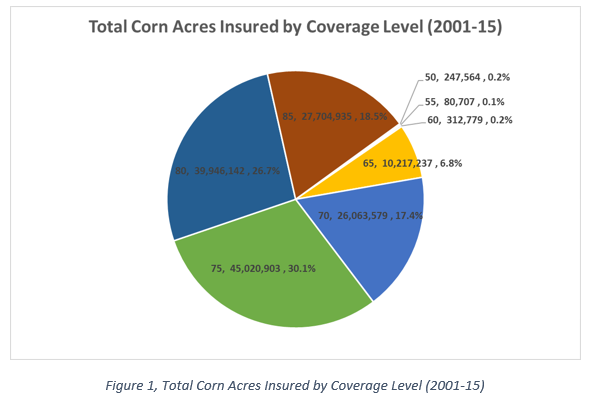
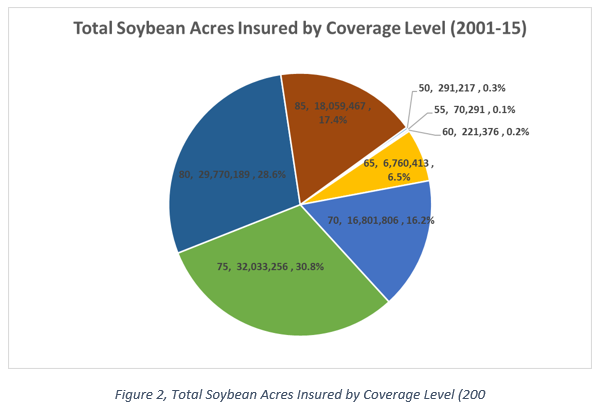
While crop insurance is broadly purchased in Iowa, selected coverage levels are quite varied. The following two charts show the total number of acres insured by crop by coverage level for all revenue-based crop insurance plans (Crop Revenue Coverage, Revenue Assurance and Revenue Protection) available from 2001-2015. As shown in Figure 1 and Figure 2, the vast majority (~93%) of crop insurance in Iowa is purchased at the 70% coverage level or higher.
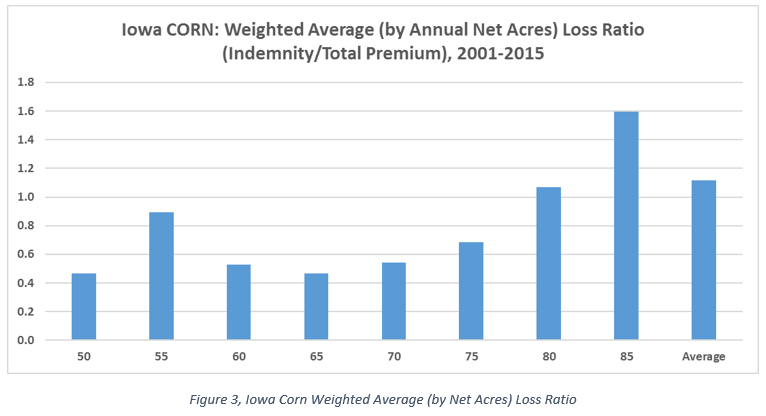
Weighted Average (by Net Acres & Year) Loss Ratio by Coverage Level
The following two charts show how crop insurance loss ratios vary across coverage levels for corn and soybeans for the years 2001-15. Data in these two charts are weighted by “Net Acres” insured at each coverage level for each year from 2001 to 2015. As shown in Figure 3 (corn), all but the 80% and 85% coverage levels are below the 1.0 loss ratio objective. Because of the high number of acres insured at the 80% and 85% coverage levels (and their propensity to individually exceed the 1.0 loss ratio objective), the overall average (Indemnities/Total Premium (2001-15) and coverage levels) is slightly above (1.12) the 1.0 loss ratio objective. The variation in loss ratios by coverage level for corn is quite variable, with the high (85% with 1.60) and low (65% with 0.47), differing by 1.13.
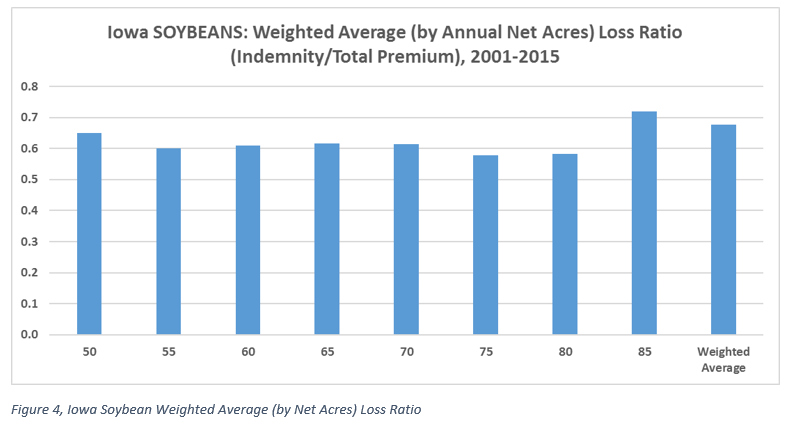
As shown in Figure 4, all coverage levels for soybeans are below the 1.0 loss ratio objective. Because all weighted average coverage level loss ratios are below the loss ratio objective of 1.0, the overall average (Indemnities/Total Premium for all years (2001-15) and coverage levels) is also well below (0.68) the 1.0 loss ratio objective. Furthermore, the variation in loss ratios by coverage level for soybeans are much more uniform, with the high (85% with 0.72) and low (75% with 0.58), only differing by 0.16.
Loss Ratio by Year
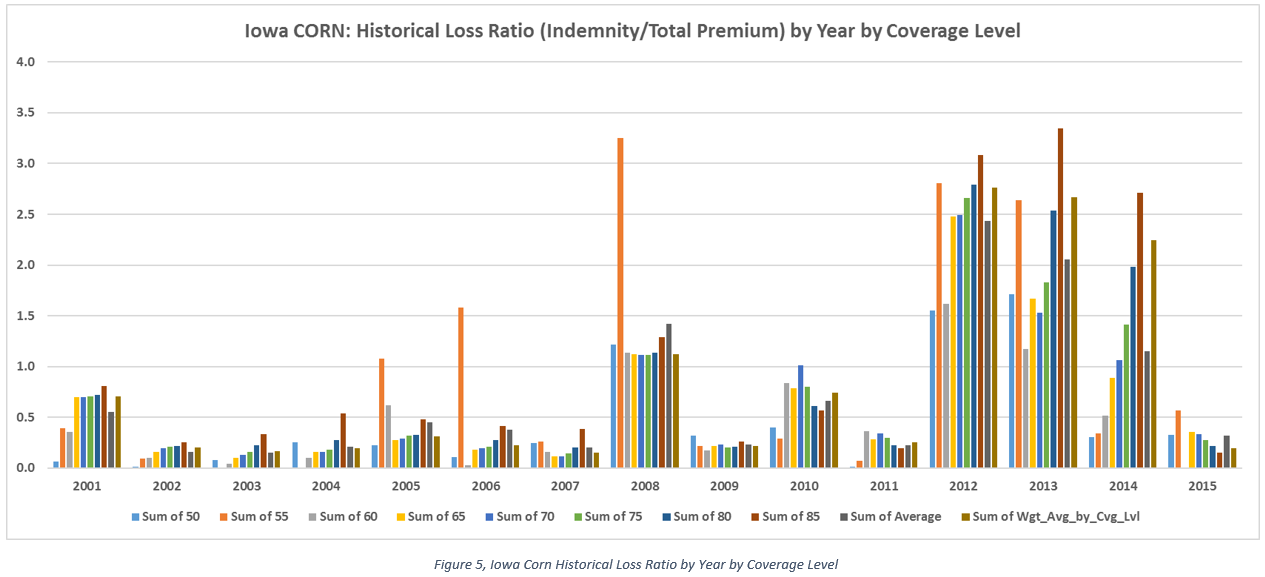
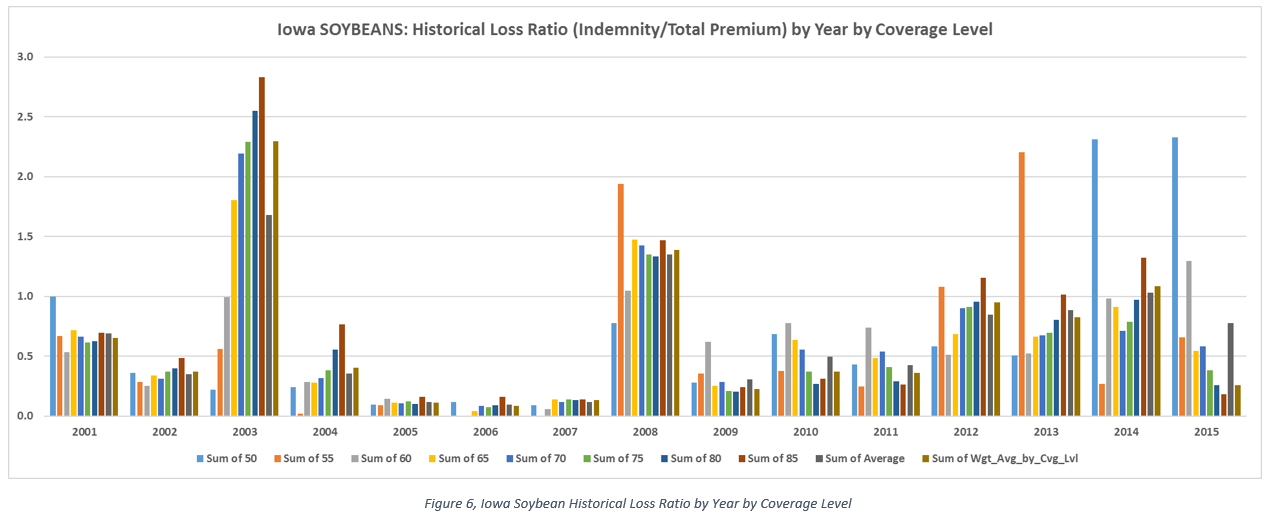
The following two charts show how crop insurance loss ratios vary across year by coverage level. The two data points in the far right of each year are 1) a simple average of all coverage levels’ loss ratios and 2) a weighted average (by number of net acres in each coverage level for a given year). As shown in Figure 5 and Figure 6, the following can be observed:
- For corn, four years (2008 and 2012-14) are the primary reason for the longer-term loss ratio exceeding the loss ratio objective.
- For corn, almost without exception, all coverage levels for these four years exceeded the 1.0 threshold.
- For corn, almost without exception, the loss ratio for the 85% coverage level is the highest of all coverage levels for all years. This suggests that the 85% coverage level is underrated.
- For soybeans, 2003 and 2008 were the years most attributed for increasing the loss ratio.
- Despite 2012 being a drought year, the loss ratio for soybeans (0.95) was much lower than for corn (2.76). This is primarily due to the soybean yield deviating less (as a percent) from trend than it did for corn in 2012.