posted on Saturday, February 1, 2020
Our Decision Innovation Solutions team usually approaches complex projects by assigning specific segments of a project to individual team members. I have had the pleasure of being assigned to the Aquaculture segment of the animal food production industry. One of the tools I have used is the USDA Census of Aquaculture. This census is conducted every 5 years in conjunction with the USDA Census of Agriculture. Data is collected for the Census of Agriculture which includes survey responses from aquaculture operators. Once the agriculture census is released the USDA follows up with the aquaculture respondents to gather more data specific to that segment.
I use the Census of Aquaculture to develop estimates on the volume of various ingredients used in the production of feed for the various species of fish, crustaceans and mollusks raised in production ponds and controlled environments. Since this data is refreshed every five years it is more difficult to create accurate estimates. A new base to work from is very helpful.
As I begin working on our project using the Census of Aquaculture as the foundation, I will be writing a few blogs. I will be discussing some of my insights gained in working with the data and subject matter experts in the aquaculture industry.
Future blogs will be featuring specific species that fall into the broad category of aquaculture. In addition to looking at individual states I will be using two other views.
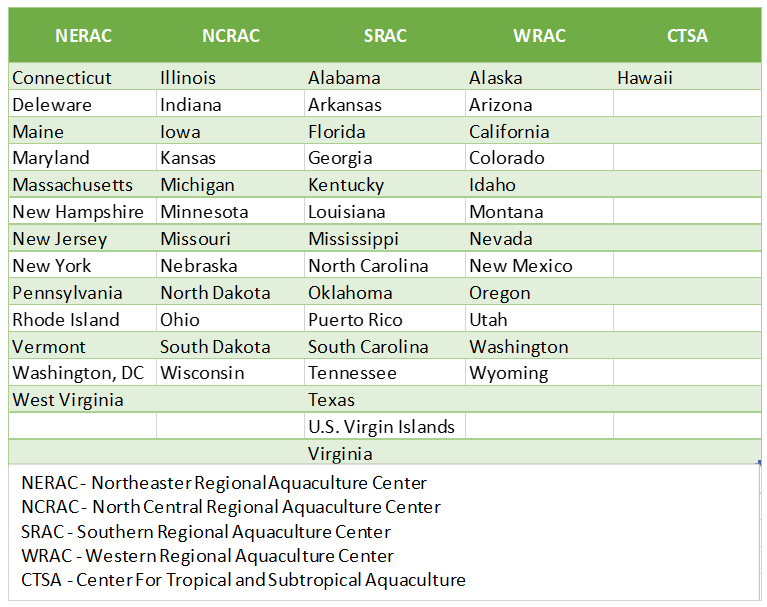
The first view is U.S. state grouping by membership in regional associations allied with the National Association of State Departments of Agriculture (NASDA). There are 4 regions within NASDA, they are Midwest, Northeast, Southern and Western. Table 1 lists the member states by NASDA region
Table 1 NASDA Regions - Membership States
.png)
The second view is U.S. state grouping by assignment to one of five Regional Aquaculture Centers established by Congress. Table 2 lists the centers and the U.S. States assigned to each center. The Center for Tropical and Subtropical Aquaculture includes other locations like the Marshall Islands and American Samoa, but they are not included in the USDA Census of Aquaculture.
Table 2 Regional Aquaculture Center - States
Here are some data highlights from the 2018 Census of Aquaculture that were provided in the release notice on the 19th of December:
- The average sales per farm was $516,944.
- Sales of food fish was $716 million, a decrease of 2% from 2013.
- The sales of mollusks was $441.8 million, an increase of 34% from 2013.
- Crustacean sales in 2018 was $100.4 million, up 18% from 2013.
- Catfish and oysters are the top species in both sales and number of farms.
- Catfish sales, valued at $366.8 million, accounted for 51% of all food fish sales in 2018.
- Oyster sales, valued at $284.9 million, accounted for 64% of mollusk sales in 2018.
- Mississippi led the nation in total aquaculture sales in 2018 with $216 million.
One observation I found interesting is that the 2013 Census of Aquaculture used the term “Operations” to describe the businesses raising the various species of aquaculture. The 2018 Census of Aquaculture uses the term “Farms”. Being a farm boy from Nebraska, I have a little trouble thinking of a cluster of buildings containing recirculating aquaculture systems (RAS) as a farm.
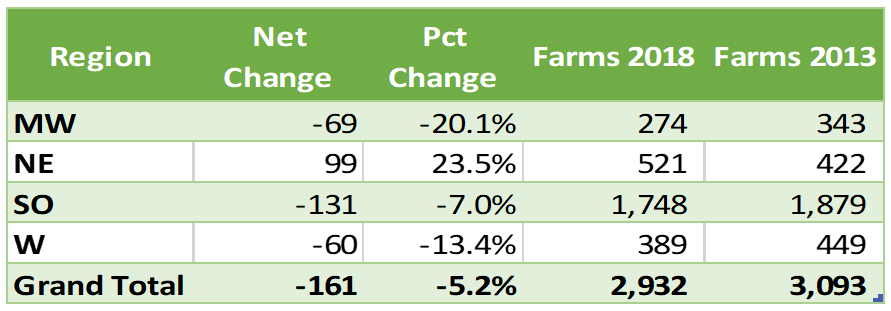
Overall there was a reduction in aquaculture operations (farms) of 161 as shown in Table 3. The Northeast is the winner over the past five-year period with a 23.5% overall increase in aquaculture operations. All of the other regions are showing a reduction in operations. For awhile there seemed to be a trend of locating aquaculture farms near the source of feed ingredients that could replace most of the expensive fish meal used in fish and crustacean feed rations. That trend seems to be reversing.
Table 3 Change in Total Operations
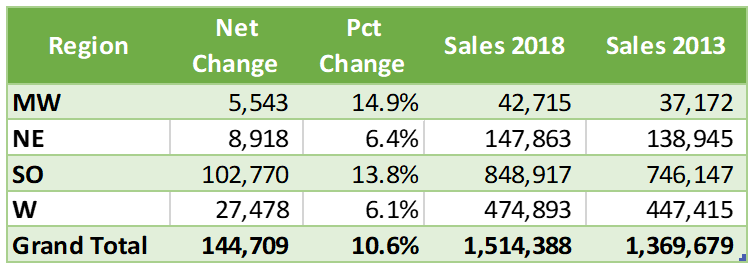
When you look at sales in the same regions as shown in Table 4, growth occurred in every region. While growth may include some increases in prices, I suspect the reduction in farms involved some closings, some consolidation, and growth of existing operations. I’ll look into that theory in a future blog.
Table 4 Change in Sales
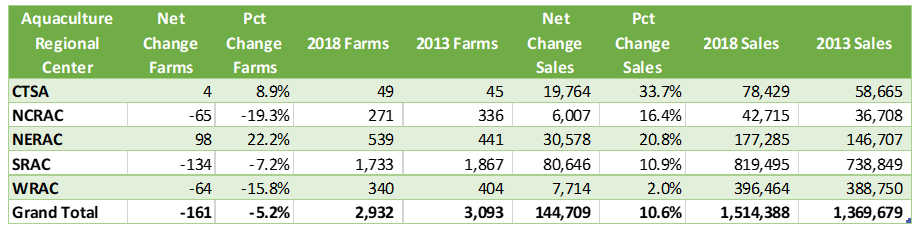
Even though the state allocations might be slightly different, Table 5 shows the Northeast as the winner in both change in farms and change in sales. I’ll see what I can learn about the industry that is driving these changes and include that in future blogs.
Table 5 Changes by Aquaculture Regional Center
The demand for protein in various forms will continue while, at the same time, the continued focus on sustainability will inform decisions on protein sources of choice. For instance, some species of food fish have a feed conversion ratio (FCR = Feed Given/Weight Gain) that is competitive with poultry. An average FCR for salmonids is 1.0 – 2.0 while the average FCR for broilers is 1.8 – 2.2. This isn’t the only factor in successful farms. There can be significant differences in operating expenses depending on the type of production methods used.
Opportunities for growth exist in all stages of raising animals to satisfy the demand for quality sources of protein and other important nutrients. I will be focusing on the aquaculture segment for awhile.
Merlin Siefken,
Business Development Manager