posted by Jing Tang on Tuesday, August 14, 2018
We have done a lot of analyses to study the relationship among monthly average ethanol prices versus ethanol ending stocks, corn cash prices, and gasoline prices. But even though the ethanol ending stocks has a statistically significant influence on the monthly average ethanol price, it is not sufficient to understand the relationship totally. Therefore, we have done a daily ethanol price analysis at the end of 2016 (see DIS Blog on February 13, 2017). Since two years have passed, we’d like to update the most recent data and study the relationship again.
We used daily gasoline price and corn cash price as the regressors; daily ethanol prices as the response variable. The same type of regression analysis was used, i.e., Generalized Linear Model (GLM), and R as the analysis software. The daily ethanol prices and daily corn cash prices were obtained from USDA; the gasoline prices are from Quandl. The study period was from October 2006 to July 2018. Still, we separated the dataset into two parts, the first one is gasoline’s price is higher than the ethanol price (total data points are 1904); the second: the gasoline’s price is lower than the ethanol price (total data points is 694, which mainly come from the last four months in 2016).
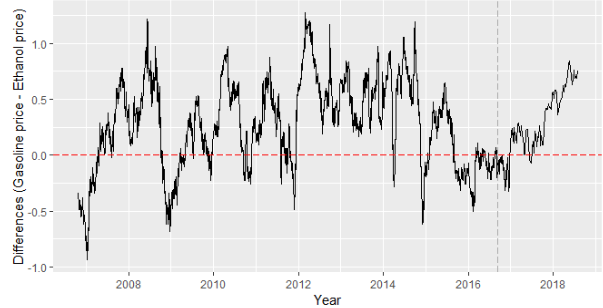
Figure 1. The difference between daily gasoline price and ethanol price from October 2006 to July 2018. Data points after the vertical black dash line are the updated data.
For the first dataset, gasoline’s price is higher than ethanol price, the correlation between daily ethanol price and gasoline price is from 0.86 to 0.85, and the correlation between daily ethanol price and corn cash price is from 0.79 to 0.81. Still, both gasoline price and corn price are strongly positive correlated with ethanol price; and under the GLM regression function, both are statistically significant (p < 0.0001). The adjusted R-square is 0.7786, indicating that 78% of daily ethanol price variation can be explained by gasoline price (42%) and corn cash price (36%). Because ethanol is the gasoline blending, which is determined by the value of petroleum-crude oil and gasoline, it’s price should follow gasoline price.
All the results correspond to our previous daily study. After 2017, the ethanol prices stay lower than the gasoline prices. Plus, ethanol price stays stable compared to the last decade.
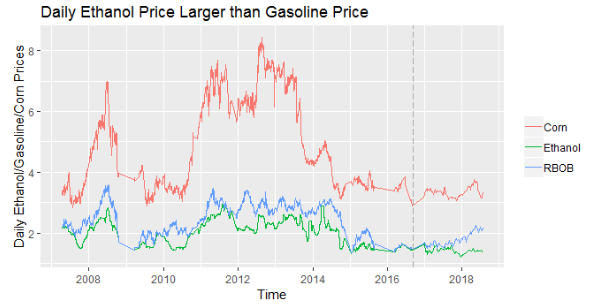
Figure 2. Trend Lines for Daily Ethanol Prices, Gasoline Prices, and Corn Cashed Prices for Dataset One. Data points after the vertical black dash line are the updated data.
For the second part of data, gasoline’s price is lower than ethanol price, the correlation between daily ethanol price and gasoline price increased to 0.92, and the correlation between daily ethanol price and corn cash price decreased to 0.74, which was 0.72 in the previous study. Under the GLM regression model, unlike the previous study, not only gasoline price has a significant positive impact (p < 0.0001) on the ethanol price, also does corn price as well (p = 0.0079 < 0.05). In the previous study, the corn price has no significant impact (p = 0.45 > 0.05) on the ethanol price. And this model for the updated dataset explained 84% variation of ethanol price, and 56% came from gasoline prices, and 28% came from the corn price.
Comparing with the trend lines plots shown in Figure 2 and Figure 3, the ethanol prices (green line) in Figure 3, follows closer to gasoline prices (blue line). We have a similar conclusion that, when the “ethanol price larger than gasoline price” situation happened, ethanol price is more likely following gasoline price. But with the new data updated, the ethanol price is influenced by the cost of productions, in this case, the corn price, which has a significantly positive impact on it. In the previous study, we didn’t see the significance come from the corn price variable.
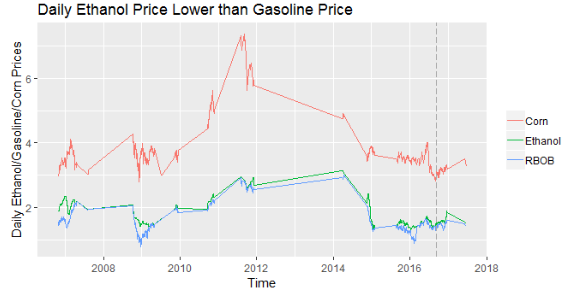
Figure 3. Trend Lines for Daily Ethanol Prices, Gasoline Prices, and Corn Cashed Prices for Dataset Two. Data points after the vertical black dash line are the updated data.