posted by Jing Tang on Monday, February 13, 2017
We have done an analysis to understand the relationship among monthly average ethanol prices versus ethanol ending stocks, corn prices, and gasoline prices. The major finding was that all of three predictors, i.e., ethanol ending stocks, corn prices, and gasoline prices, have statistically significant influences on monthly average ethanol prices. This model explained 77% of monthly average ethanol price variation, in the following order: gasoline prices (35.5%), corn prices (31.5%) and followed by ending stocks (10%).
However, ethanol prices change every day, monthly average ethanol prices could aggregate out some of the variation. Plus, the low ethanol price, compare to the gasoline price, could lead to different results. So we dug into a more detail study that uses daily ethanol prices as the interested response variable. Since daily ethanol ending stocks is meaningless, in this new study, we only involved daily gasoline price and corn cash price as the regressors.
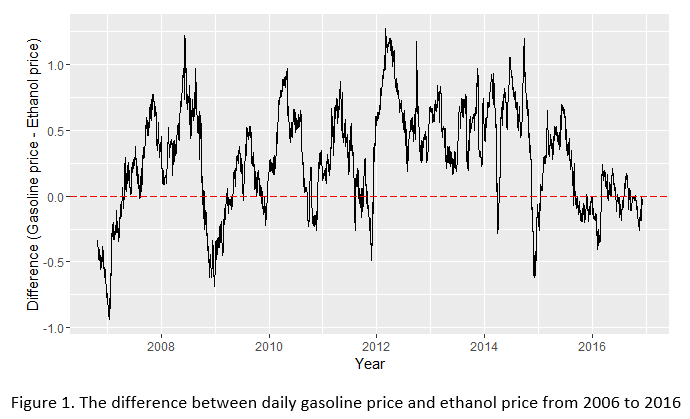
Ethanol used to be a relatively cheap substitution for octane boosters such as MTBE, it is used as a gasoline blend. However, during some time periods, the ethanol prices were higher than gasoline prices, especially after the summer of 2014 (shown in Figure 1). Wholesale gasoline prices have largely followed the sharp decline in crude oil price and reached about $1 per gallon, a level not seen in over a decade. It will be better to study separately, based on the difference between ethanol prices and gasoline prices. Therefore, we split the dataset into two parts, one is gasoline’s price is higher than ethanol price (1859 data points), the other one is gasoline’s price is lower than ethanol price (633 data points).
The same type of regression analysis was used, i.e., Generalized Linear Model (GLM), and still using R as the analysis software. The daily ethanol prices were obtained from USDA; the daily corn cash prices were downloaded from Jacobsen, and the gasoline prices were got from Quandl. The study period was 10 years, from 2006 October to 2016 December.
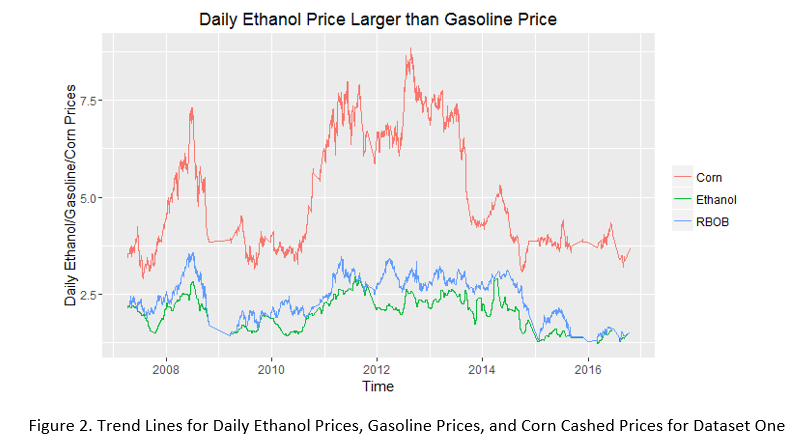
For the first dataset, gasoline’s price is higher than ethanol price, the correlation between daily ethanol price and gasoline price is 0.86, and the correlation between daily ethanol price and corn cash price is 0.79. Both gasoline price and corn price are strongly positive correlated with ethanol price; and under the GLM regression function, both of them are statistically significant (p < 0.0001). The adjusted R-square is 0.78, indicates that 78% of daily ethanol price variation can be explained by gasoline price (44%) and corn cash price (34%). All of the results are corresponding to our previous monthly average study. Because ethanol is the gasoline blending, which is determined by the value of petroleum-crude oil and gasoline, it’s price should follow by gasoline price.
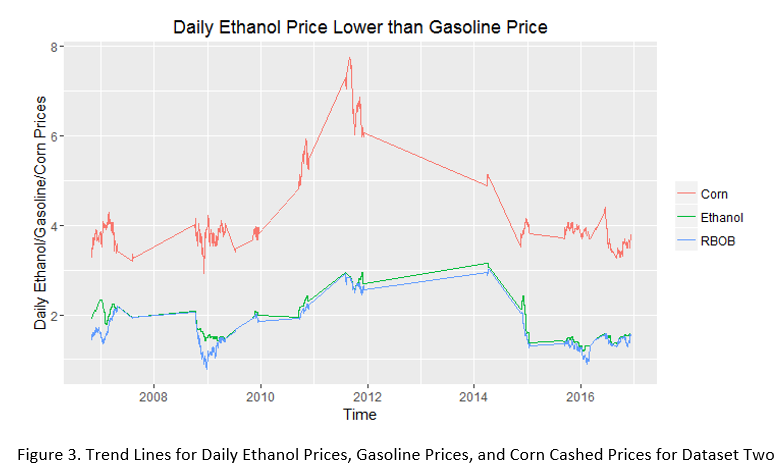
For the second part of data, gasoline’s price is lower than ethanol price, the correlation between daily ethanol price and gasoline price increased to 0.92, and the correlation between daily ethanol price and corn cash price decreased to 0.72. Under the GLM regression model, only gasoline price has a significant positive impact (p < 0.0001) on the ethanol price; while corn price is not significant any more (p = 0.45 > 0.01). This model explained 85% variation of ethanol price, and near 60% came from gasoline prices.
Comparing with the trend lines plots shown in Figure 2 and Figure 3, the ethanol prices (green line) in Figure 3, follows closer to gasoline prices (blue line). It indicates that when the “ethanol price larger than gasoline price” situation happened, ethanol price is more likely following gasoline price. We haven’t known the reason clearly. We expected that under this situation, the ethanol price should mainly follow by the cost of productions, for instance, the corn price, at least the corn price should be the dominant predictor. But the data analysis showed the opposite way, not only the corn price is not the dominant predictor, but also it is not significant in the model.
- ethanol
- statistics