posted by Jing Tang on Thursday, June 24, 2021
This series report has been prepared over two years, starting in 2019 with the abnormal weather event that caused serious flooding in the main corn planting states. In this first report, we discussed how the delays in corn planting progress influenced the ethanol gross production margin (GPM) values. Following the flooding in 2019, 2020 came with its own unprecedented and unique difficulties as the COVID-19 pandemic unfolded. In the second report, we looked at the first three months of the pandemic – March to May – and discussed how the GPM behaved in this new situation. Although the pandemic has not officially ended, the U.S. appears to be in the recovery stages. In this article, we will focus on the behavior of GPM during the second half of 2020 and 2021 thus far.
The gross production margin in the ethanol industry commonly represents the difference between the price of corn and the combined sales value of ethanol, and its co-products: distiller’s dried grains (DDGs) and distillers corn oil (DCO). The GPM shows the calculated relationship between the value of ethanol and ethanol co-products and the cost of corn in ethanol production.
Figure 1 shows the monthly average of Iowa’s ethanol GPM for the years 2020 and 2021, represented respectively by a solid line and dashed line. This figure also includes Iowa’s ethanol GPM three-year average – 2018 to 2020 – for each month.
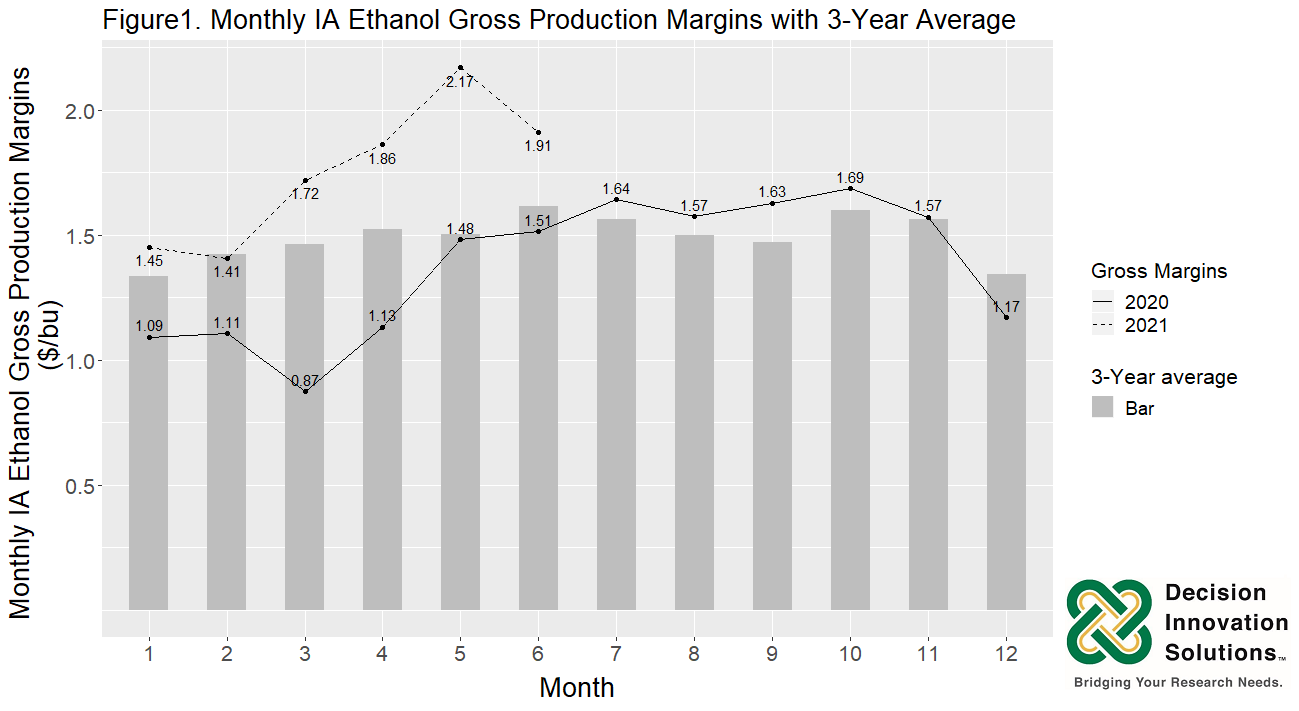
All monthly GPMs in the first half-year of 2020 were below the three-year average (for more details, please check out the previous blog), and while most of the GPMs in the second half-year of 2020 were slightly over the three-year average, overall, the majority of 2020’s monthly averages fell below the three-year average. Conversely, 2021 values are proving more optimistic with almost all monthly average GPMs having been above the three-year average.
Looking at the second half of 2020: The average corn price from July 2020 to October 2020 was $3.34/bu, $0.56/bu lower than the corresponding price in 2019 – $3.90/bu –, while the average sales value of both DDGs and DCO were slightly above those in 2019. Therefore, based on the GPM calculation, the average GPM over these months ended up being slightly over the three-year average. However, during the last two months of 2020 corn prices increased to $4.08/bu in November and $4.20/bu in December for an average across both months of $4.14/bu. This was an increase of about 24% when compared to the average corn price from July 2020 to October 2020. On top of this DDGs values decreased by about 44% during the same period, resulting in the GPMs drop from $1.63/bu (average GPM from July 2020 to October 2020) to $1.57/bu November and $1.17/bu in December.
Looking at the first half of 2021: The average GMP for every month apart from February has been higher than the three-year average, with each month following a similar pattern to that seen in January 2021.
In comparison to January 2020, the GPM increased by 33%, from $1.09/bu to $1.45/bu – largely due to higher sale values of ethanol and its co-products. The sale values of ethanol, DDGs, and DCO in January 2021 were higher than those experienced in both 2020 and 2019. The sale values of ethanol, DDGs, and DCO in January 2021 were $3.95, $1.94, and $0.24 respectively. In 2020 these sale values were $3.48, $1.29, and $0.15; and $3.28, $1.42, and $0.14 in 2019.
In Figure 2, the scatter points represent the weekly sales values – raw data from the AMS weekly report – for corn, ethanol, DDGS, and DCO using green, yellow, blue, and red respectively. The boxplots in pink, represent the range of weekly IA ethanol GPMs.
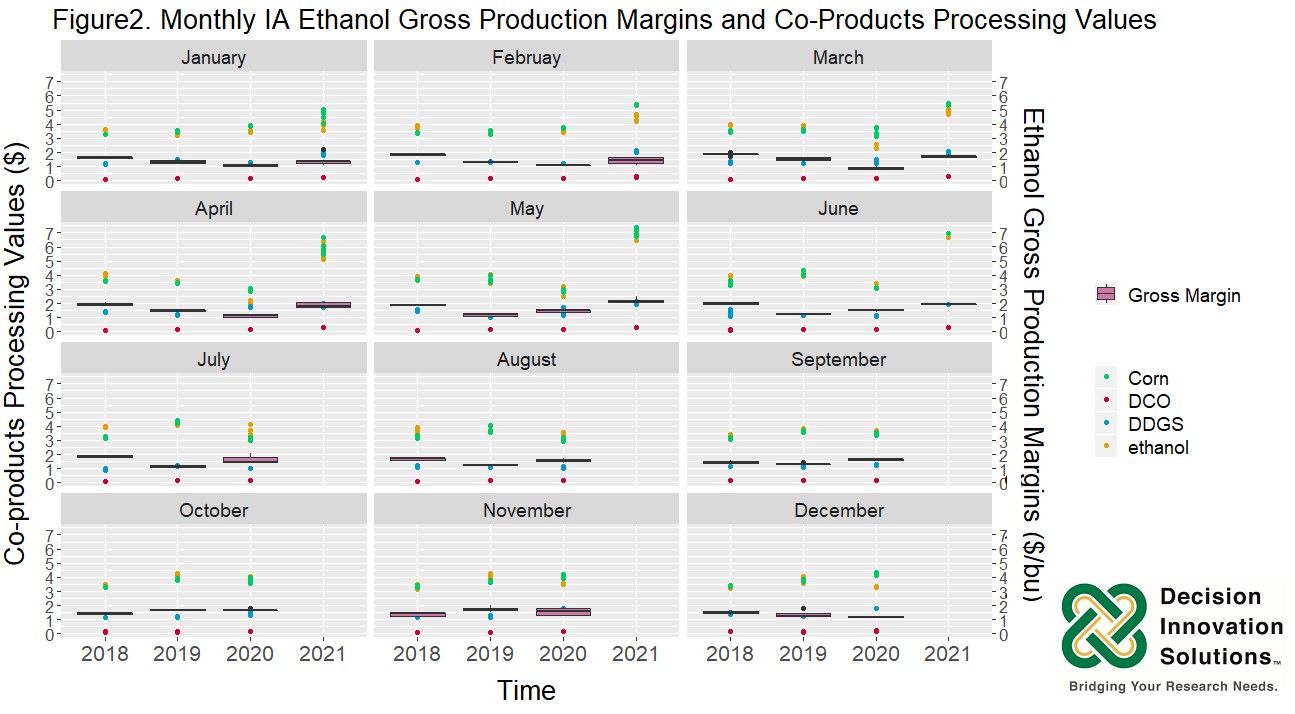
We applied the ANOVA and Tukey-HSD tests to the study period, i.e., January 2018 to June 2021, and found that:
- For the first half-year, in general (averaging the 6-month GPM values), the GPM values in 2019 and 2020 were significantly lower than 2018 and 2021; there is no significant difference between the GPM values in 2019 and 2020, and there is no significant difference between the GPM values in 2018 and 2021. However, in April and May, the GPM values in 2021 are significantly higher than all other years.
- For the second half-year, in general (averaging the 6-month GPM values), there is no significant difference among the GPM values from 2018 to 2020. However, in July, August, and September, the GPMs in 2019 have significantly lower values than in 2018 and 2020. Also, in October and November, the GPMs in 2018 are significantly lower than in 2019 and 2020 whereas there is no significant difference in December GPM values.
Applying the Pearson correlation test, we found that within the study period, corn prices have had a strong significant negative effect in July and August, this effect becomes weaker but still significant as time moves forward. However, corn prices had no significant effect in November.
The sale value of DDGs had no effect on the GPMs for January through to April. However, with August as the exception, from May through to October the sale value of DDGs had a significant positive effect; and after November, the sale value of DDGs yet again had no effect on GPM values.
The sale value of DCO has had a significant positive effect on the GPMs in May, September, and October, while it has had a significant negative effect in July and December; No other significant effect was found in any other months.
The sale value of ethanol has had a significant positive effect on GPM, in the months' March, April, May, October, and November, but no significant effect in other months.
In summary, with regard to the 2021 GPM values: The ethanol price (ethanol sale value) is the dominant variable in March to May, the DDGs price (DDGs sale value) is the dominant variable in June, and both have significant positive effects on the GPM values. We found a similar conclusion in previous analyses, in that the ethanol price became the dominant variable. From the EIA Fuel ethanol overview table, ethanol fuel production is slowly returning to normal, but is still relatively low when compared to 2018 and 2019 levels. Ethanol fuel production may still have a continuous influence on the ethanol price and value which in turn is expected to influence the GPM values.
This was a general analysis of the GPM as we understand that various industries – such as ethanol production, corn production, and the feed industry, etc. – use the GPM and/or the co-product sale values from different perspectives to aid in the making of a variety of important business decisions. Let us know how you use the GPM, and which dominant variable has the most effect on your business.
*All data came from the Iowa Ethanol Corn and Co-Products Processing Values Report and the National Daily Ethanol Report from the USDA AMS website – The latest data was updated on June 4th, 2021.