posted by Jing Tang on Thursday, October 27, 2022
We’ve conducted this series report over three years. It started with an abnormal weather events (serious flooding in the main corn planted states) in 2019, in which we discussed how the delays in corn planting process influenced the ethanol gross production margin (GPM) values. And in 2020, there have been unique and difficult situations due to the COVID-19 pandemic. In the last two blogs, we discussed how the GPM behaved since the pandemic started in 2020 March up to June 2021. After recovering from the pandemic, and ethanol value reached to a high level since 2014, in this article, we will focus on the behavior of GPM in the time frame from June 2021 to July 2022.
The gross production margin, in the ethanol industry, commonly represents the difference between the combined sales values of ethanol, distiller’s dried grains (DDGS) and distillers corn oil (DCO), and the price of corn. All data came from Iowa Ethanol Corn and Co-Products Processing Values Report and National Daily Ethanol Report from the USDA AMS website. The latest data was updated on July 29th, 2022 (when the blog is written on October 26th, 2022). GPM calculation shows the calculated relationship between values of ethanol and ethanol co-products and the cost of corn in ethanol production.
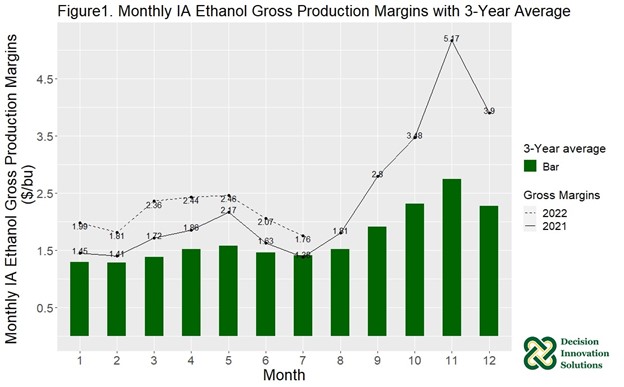
Figure1 shows the monthly average Iowa ethanol GPM of the year 2021 and 2022, in solid line and dashed line, respectively. Also, it shows the three-year average (2019 to 2021) Iowa ethanol GPM for each month. All monthly GPMs in 2021 and in first half year of 2022 have been above the three-year average values.
Within the study time frame, average corn prices were $5.86/bu and $7.23/bu for 2021 and 2022, respectively, which were higher than the correspond prices in 2019 and 2020, which were $3.73/bu and $3.47/bu, respectively. Corn prices increased about 68.9% from 2020 to 2021 and increased another 23.4% from 2021 to 2022.
Calculated GPMs have been extremely high compared to the historical average GPM values. Especially, in the last quarter in 2021, the average GPM was $3.84/bu, which is two times higher than the average GPM in 2020. Although corn prices increased as mentioned above, DCO values and ethanol values in the study frame were much higher than prices in 2020 and the first half of 2021.
Average DCO values were $0.35/bu and $0.45/bu for the second half year of 2021 and first half year of 2022, respectively, reflecting increases of about 21% and 55%, compared to the average DCO value ($0.29/bu) during the first half year of 2021. Plus, ethanol values increased about 32% and 26% during the same period. Thus, the GPMs jumped from $1.71/bu (average GPM from first half year of 2021) to $3.09/bu and $2.15/bu in the second half year of 2021 and first half year of 2022, respectively.
In Figure 2, the scatter points represent the weekly sales values (raw data from AMS weekly report) for corn, ethanol, DDGS, and DCO using green, yellow, blue, and red color, respectively. The boxplots in pink color, represent the range of weekly IA ethanol GPMs.
Applying ANOVA and the Tukey-HSD test on the study period, i.e., January in 2019 to July in 2022, we found that:
- For the first half-year, in general (combine 6-month GPM values), the GPM values in 2021 and 2022 are significantly higher than 2019 and 2020; and there is no significant difference between the GPM values in 2019 and 2020.
- For the second half-year, in general (combined 6-month GPM values), only the GPM value in 2021 is significantly higher than other years. There is no significant difference among the GPM values among 2019, 2020 and 2022.
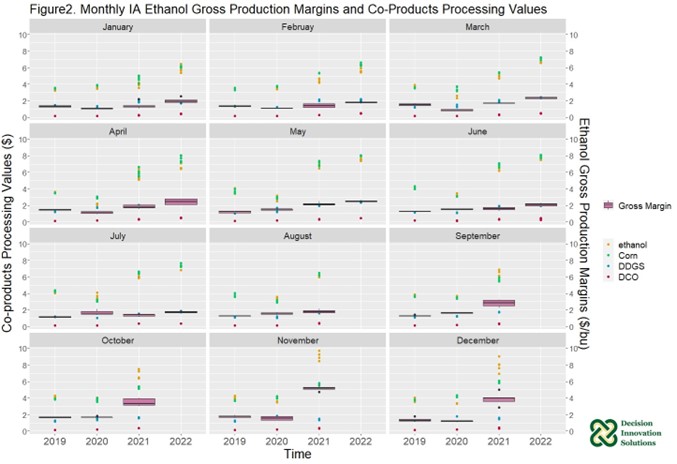
Applying the Pearson correlation test, we found that within the study period, corn price has had strong significant negative effect in the month of August and September, and the effect becomes weaker but still significant as the time moving forward. When getting into the month of December, corn price doesn’t have any significant effect.
The sale value of DDGs has had significant positive effect on GPM for the months of July and August. While from September 2021 through March 2022, the sale value of DDGs had significant negative effect, except for February 2022. After April 2022, the sale value of DDGs had significant positive effect on GPM values again.
The sale value of DCO had significant positive effect on GPMs in the month of August and October, while it had significant negative effect in the month of November through February. Then after March 2022, the sign of correlation become positive, but has not found any significance. The sale value of ethanol has had strong significant positive effect on GPM, in almost all months during the study period, except March and June 2022.
In summary, the ethanol price (ethanol sale value) is the dominant variable throughout the study period, that has strong significant positive effect on GPM values. A similar conclusion was found in previous analysis -- that the ethanol price became the dominant variable since the second half year of 2020. This was because fuel ethanol production is slowly returning to normal, but still relatively low compared with 2018 and 2019 level. Another observation is that fuel ethanol production in 2021 was similar to 2015’s level, but still below 2018 and 2019 production levels. Another reason that ethanol prices increased is related to the high gasoline prices seen in 2021 and 2022.