posted by David Miller on Tuesday, January 3, 2023
There are those who say “the market is never wrong” regardless of how current prices relate to historical fundamentals. That could be at play in the current corn and soybean markets.
Figure 1 shows the relationship of prices of the March corn contract on the day of release of the January WASDE report to the underlying stocks to use ratio as reported in the January WASDE report. Assuming the market is “not wrong,” there appears to have been a shift upward in corn prices relative to the stocks-to-use (S/U) ratio that began to be manifest in January 2022. While this was before Russia invaded Ukraine, there were military build-ups along the Ukrainian border that began before Russia actually invaded Ukraine.
Corn prices on the day of the January 2022 WASDE report should have been about $4.87 per bushel if the historical price to S/U ratio had been in place. Another way to view the data is that rather than a 10.38% S/U ratio, the price of corn after the release of the January 2022 WASDE report reflected prices that would historically have been associated with a S/U ratio of 7.4%
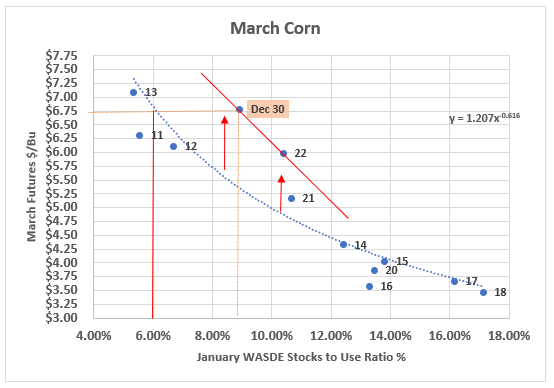
Figure 1. March Corn
So, where do we stand now in the corn market? As of December 30, 2022, the March 2023 corn contract closed at $6.79 per bushel. This price would be associated with a historical S/U ratio of 6%. But the S/U ratio in the December 2022 WASDE was 8.91%. The corn price historically associated with an 8.91% S/U ratio is $5.35 per bushel. Does the difference between the historically-predicted price of $5.35 per bushel and the current price of $6.79 per bushel reflect a ‘war premium” of $1.44 per bushel in the current corn market, or has there been a somewhat permanent shift upward in the demand curve for corn as indicated by the line that goes through the “Dec 30 dot and the “22” dot in Figure 1?
A similar situation exists for March soybeans. As shown in Figure 2, the 2022 price of March soybeans in January 2022 of $14.18 per bushel was more than $2 per bushel higher than predicted by the historical price-to-S/U ratio. The price of March 23 soybeans futures on December 30, 2022 was $15.24 per bushel. This price is $1.92 per bushel higher than the predicted price of March soybeans when the S/U ratio is 4.98%. A price of $15.24 historically would be associated with an S/U ratio of 3.22%. Again, the question that needs to be asked is, “has there been a shift upward in the demand curve for soybeans? If so, then the current premium in the marketplace might be maintained. If not, then the market is pricing in a decline in the S/U ratio due to stronger forward demand, or downward price risk is in the current corn and soybean markets. Just some thoughts to consider when looking at the January 2023 WASDE report released on Jan 12, 2023.
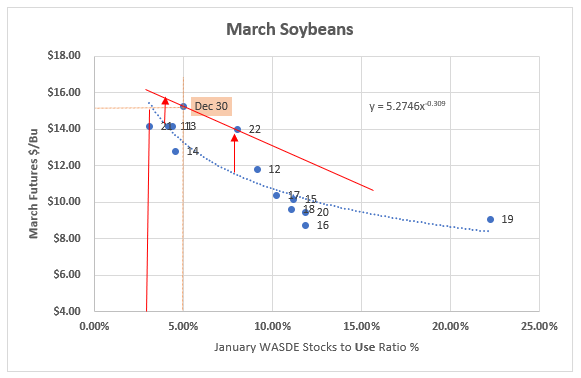
Figure 2. March Soybeans