posted by Kade Grafel on Monday, October 3, 2022
Kansas Commodity Flow Highlights
Here at DIS, we have recently completed an Agribusiness Commodity Flow Study for the Kansas Department of Agriculture. This was a very exciting project that took a comprehensive look at the movement of agricultural commodities throughout Kansas and its neighboring states. The movement of these commodities was analyzed using our Dynamic Flow Analysis methodology.
One of the goals of a commodity flow study is to identify opportunities for additional value-added activities to occur within a certain region. Below is a highlight and explanation of one such opportunity that we identified in this study.
Kansas Corn Production
Figure 1 shows destination of Kansas corn at the county level according to our dynamic commodity flow model. Around 47% of the corn produced in Kansas is used in Kansas (either as feed or in further processing), while the remaining 53% leaves the state for use or export.
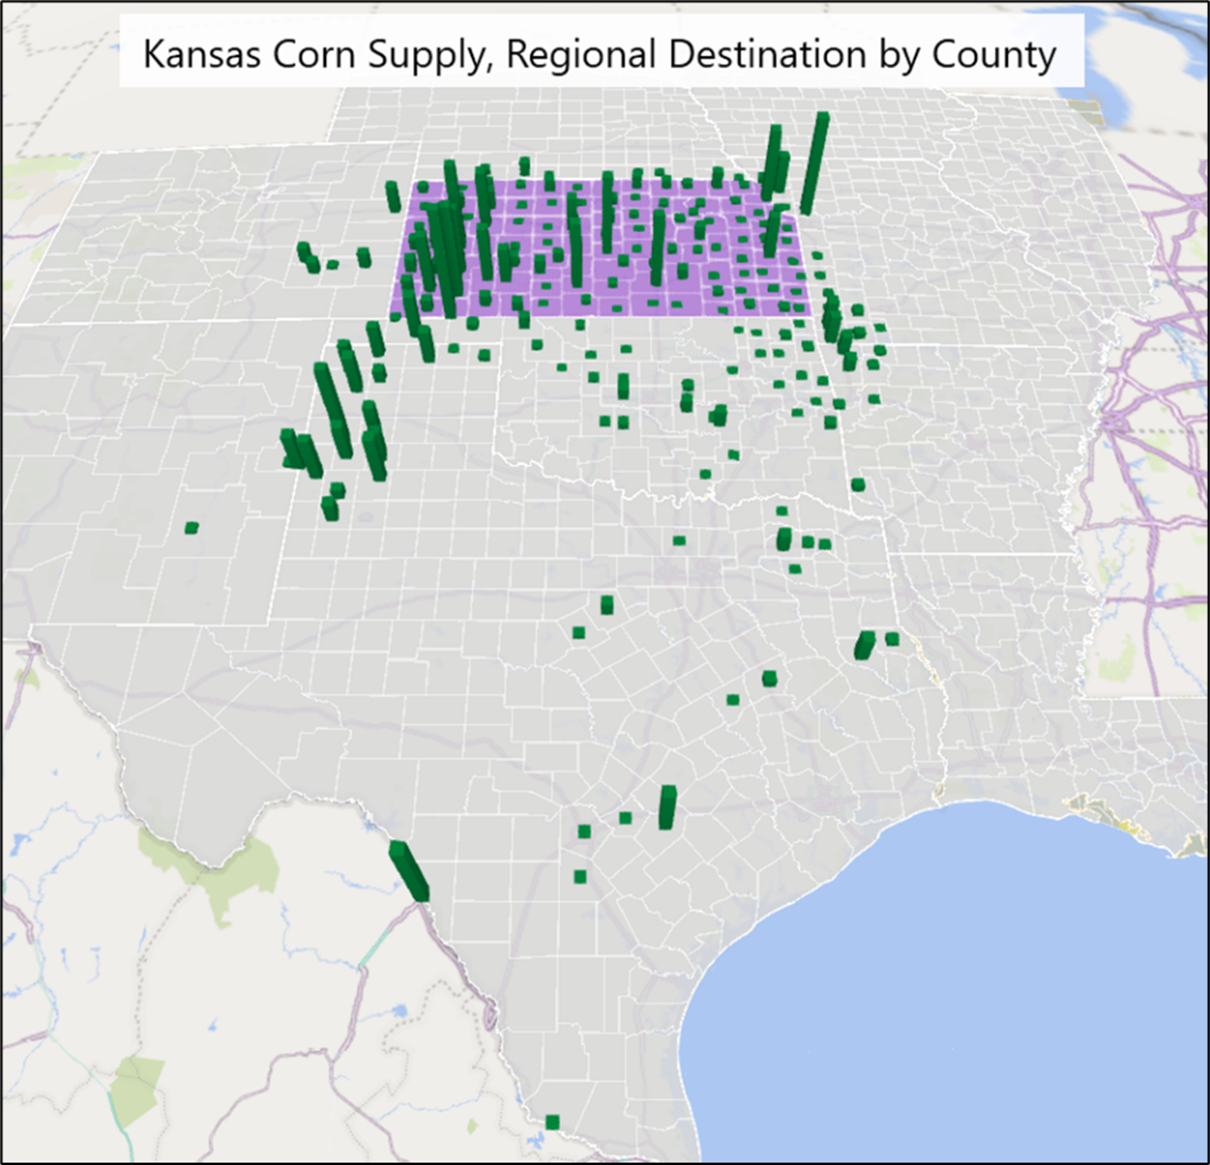
Figure 1. Destination of Kansas Corn Supply
Kansas Ethanol Flow
Geographically, Kansas is on the frontier of ethanol production, as shown in Figure 2. While Kansas ethanol production is small relative to that of Iowa and Nebraska, there is a lack of ethanol production to the south and west of Kansas, with only three ethanol plants in northern Texas. However, there is still significant demand in this area, resulting in a regional supply deficit. While this study was conducted using 2020 data, demand for ethanol may increase further in the near future due to expanded availability of E15.
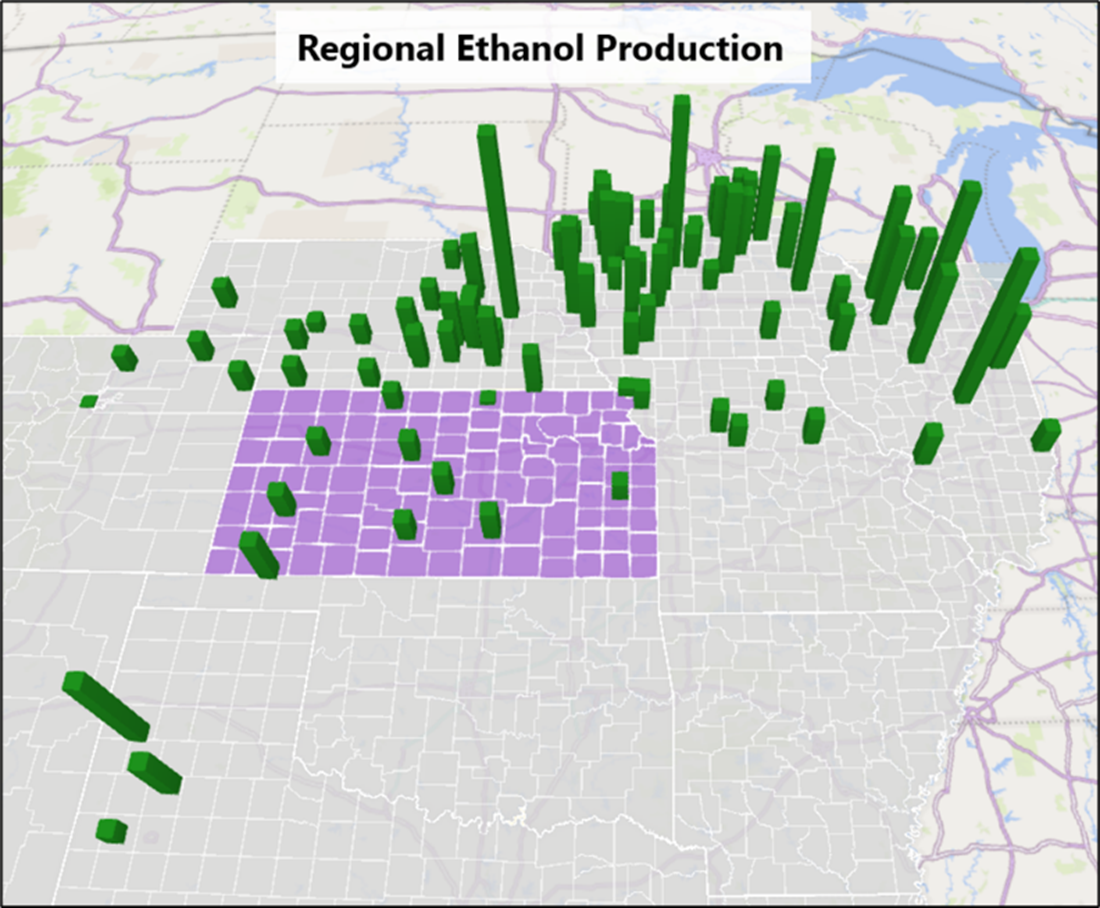
Figure 2. Regional Ethanol Production
Figure 3 shows the destination of Kansas ethanol production. Our model estimates that most ethanol produced in Kansas goes to Colorado, New Mexico, Oklahoma, and Texas.
.png)
Figure 3. Destination of Kansas Ethanol Supply
Demand for ethanol from these states is so strong, in fact, that Kansas demand is not fully satisfied by Kansas production. Around half of Kansas’s ethanol demand is satisfied by backfilling from Iowa, Missouri, and Nebraska. Figure 4 shows the counties that supply ethanol to Kansas.
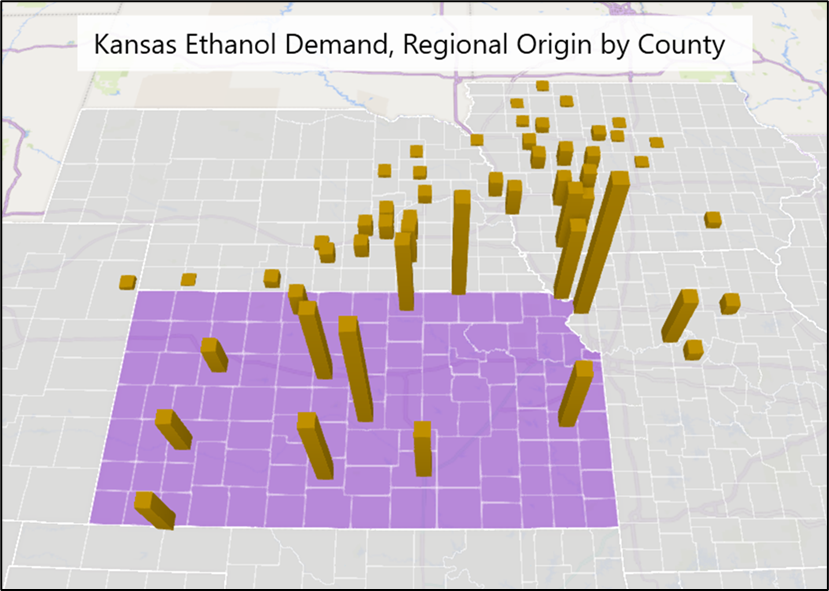
Figure 4. Origin of Kansas Ethanol Demand
Kansas DDG Flow
The regional supply and demand of dried distillers’ grains (DDGs) is very similar to that of ethanol. Since DDGs and ethanol come from the same facilities, their relative supplies are roughly the same. There is a significant demand for DDGs to the south of Kansas, in large part due to the cattle industry in Oklahoma and Texas.
This similar setup yields similar results. Texas and Oklahoma pull heavily from Kansas’s DDG supply (Figure 5), and Kansas’s DDG demand is backfilled by production to the north and east, particularly from plants in Nebraska and Iowa (Figure 6).
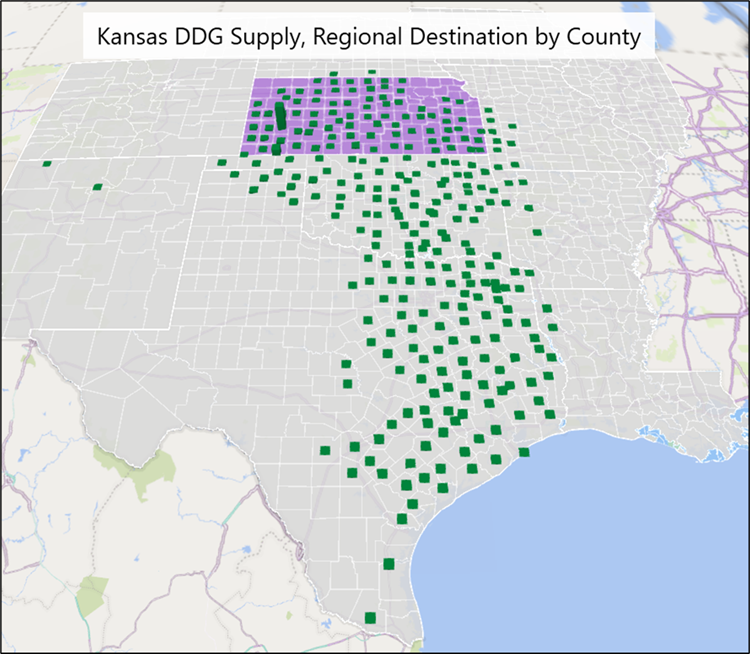
Figure 5. Destination of Kansas DDG Supply
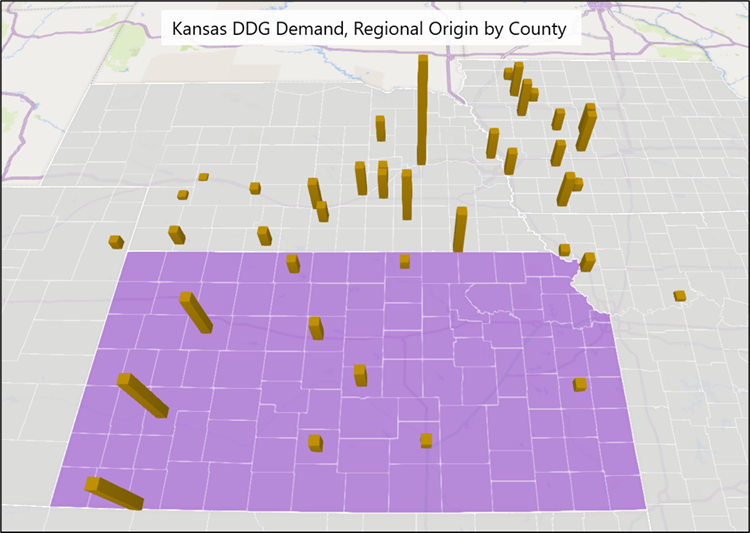
Figure 6. Origin of Kansas DDG Demand
Conclusion
In summary, our analysis shows the following:
More than half of Kansas corn leaves the state for use in feed, processing, or export
Kansas is on the geographic edge of ethanol production, and Kansas plants are some of the closest potential suppliers of ethanol to major population centers in Colorado, Oklahoma, New Mexico, and Texas.
There appears to be ample demand for ethanol and DDGs in the region.
These results suggest that there is capacity for expanded ethanol production in Kansas. Corn that would otherwise leave the state could instead be used in value-added processing inside the state, and both the main product (ethanol) and byproduct (DDGs) could be used by Kansas or the surrounding states.
See the full report for more information on methodology and other insights about agriculture in Kansas and the surrounding region: read more!