posted by Jing Tang on Thursday, September 20, 2018
Nowadays, more and more people pay attention to data and information and how to use them in a proper way. Analyzing data includes not only collecting raw data but also how to convert the numbers to inform a company’s strategy and decision making. A small improvement in data analysis can lead to a big financial return for companies.
For example, looking at the price of Distiller Corn Oil (DCO). With the increase of corn production, from 13.83 billion bushels in 2013 to 14.6 billion bushels in 2017 (USDA NASS), the coproduct DCO’s production from dry-mill ethanol plants has grown dramatically. It can be used in biodiesel plants, the animal feed industry, and exported to other countries. However, DCO prices are not very transparent in the coproduct market, as shown in our previous blog.
Because of markets that are not transparent, we need to use advanced models to predict and forecast the DCO price in this blog. Historic daily DCO prices, from 2012 January to 2017 May, were downloaded from Jacobsen. And we are forecasting the “future price” of DCO for the next four months, i.e., from 2017 June to 2017 September, then comparing them with the actual, or experienced values. Ordinary least square regression model (OLS), Generalize linear model (GLM), and Generalized linear Mixed Model (GLMM) are applied. For all models, the combination of predictors (independent variables) are the same.
Simple OLS regression is usually used when there is a continuous response variable and a set of explanatory variables by the principle of least squares. The distribution of the OLS error terms is gaussian and the link function is the identity function. When compared with OLS regression, GLM allows for different error distributions and also allows the response variable to have a different (nonlinear, binary, etc.) relationship with the independent variables. Moreover, GLMM, an extension for GLM, allows for having “dependent errors”. The “dependent errors” refers to random effects in addition to the usual fixed effects.
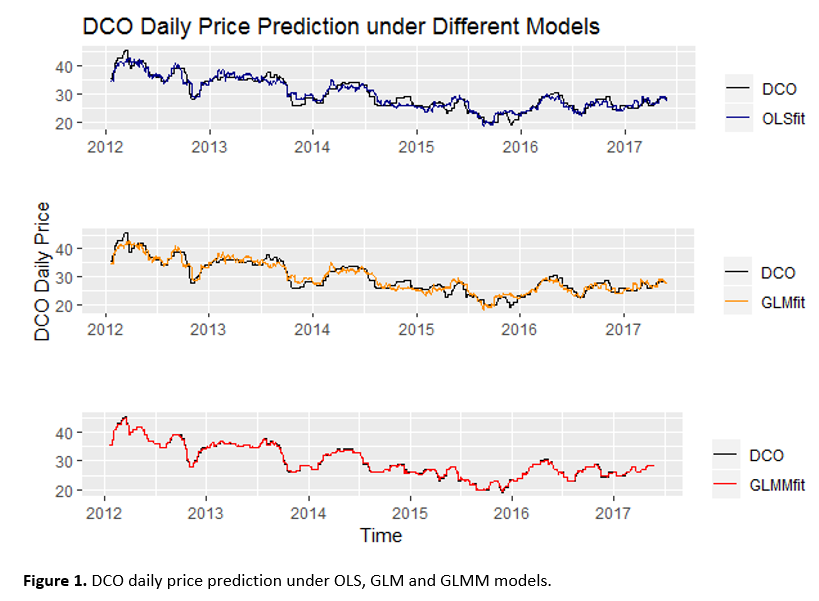
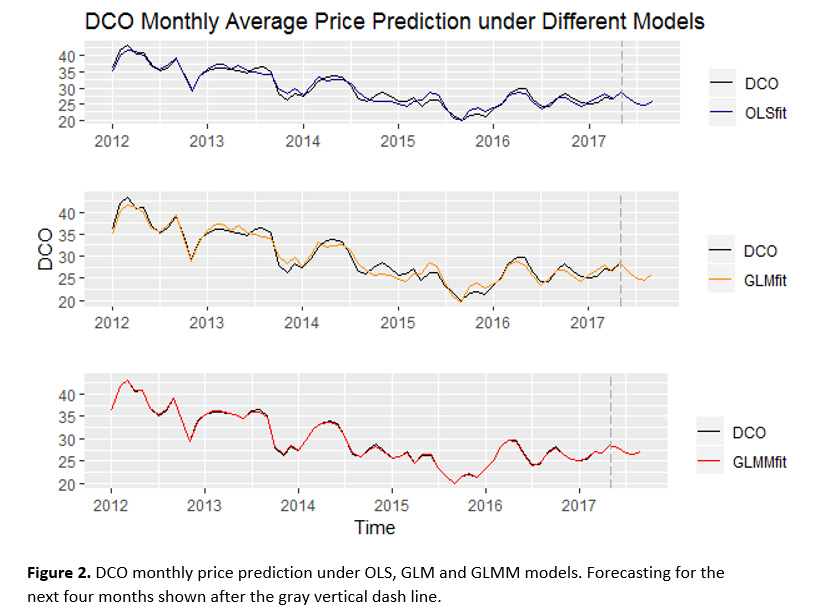
Figure 1 shows daily DCO price prediction under the three models. The black line represents the actual value of DCO’s price, the blue line, orange line, and red line represent the predicted DCO’s price under OLS model, GLM model and GLMM model, respectively. Figure 2 shows monthly average DCO price predictions under the three models, with the same color line designation. From both figures, we can easily tell that using GLMM fits the best among these three models. That means the forecasting result from the GLMM model appears to be the most accurate forecast compared to the other two models. We applied daily data for prediction only, i.e., trained the models with daily data, predicted within the same dataset (from 2012 January to 2017 May), and checked the accuracy for each model. While using monthly data, we trained models, predicted DCO monthly prices (from 2012 January to 2017 May) and check the models’ accuracies, also forecasted the future monthly prices (from 2017 June to 2017 September). Forecasting results are shown in Figure 2, after the gray vertical dashed line.
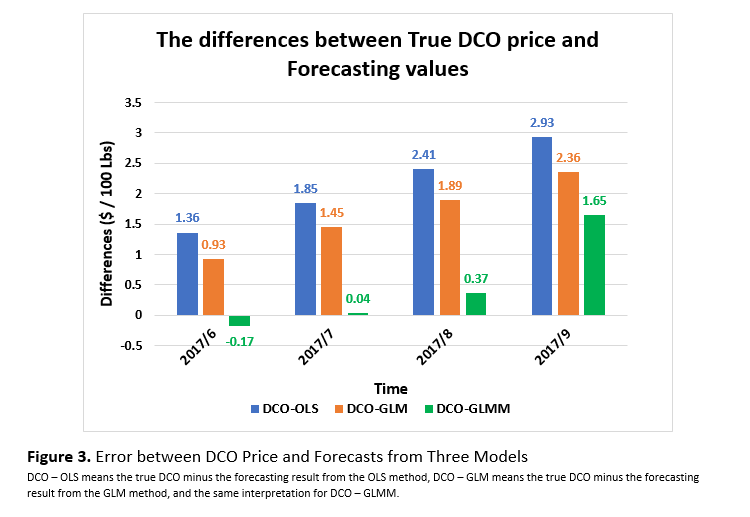
Since we didn’t include the June 2017 to September 2017 data into our raw dataset, we assumed that those four months’ DCO prices are unknown. Therefore, we can check the accuracy of the three models, as shown in Figure 3. The smaller the difference, the more accurate the forecasting result. In this example, the GLMM model works the best. But it may not always be the case. To decide which model or statistical method should be applied always depends on the data and research purposes.
With a slightly improved process in data analysis, we can achieve a substantial improvement in forecasting. We can’t forecast the future of the market, but we can eliminate some guessing to reduce the risk and understand the future market’s behavior.