posted by S. Patricia Batres-Marquez on Thursday, March 22, 2018
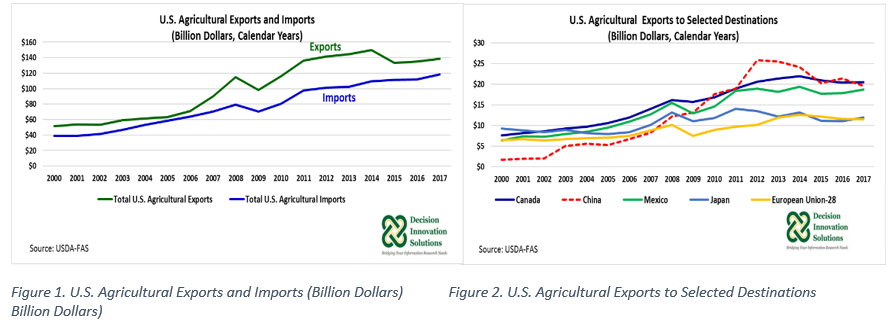
USDA-FAS agricultural trade data indicates the United States shipped $138.5 billion worth of agricultural products around the world in the 2017 calendar year, up 2.8 percent from 2016 ($134.8 billion). This was the third consecutive year of U.S. agricultural export expansion, but 2017 exports remained below the 2013 record high of $144.3 billion. U.S. agricultural imports also increased in 2017, from $112.0 billion in 2016 to $118.2 in 2017, narrowing the U.S. agricultural trade gap from $22.8 billion, the surplus in 2016, to $20.3 billion, the surplus in 2017 (see Figure 1).
The 2017 top five destinations for U.S. agricultural products were Canada ($20.5 billion, 14.8 percent share of U.S. exports), China ($19.6 billion, 14.2 percent share of U.S. exports), Mexico ($18.7 billion, 13.5 percent share of U.S. exports), Japan ($11.9 billion, 8.6 percent), and the European Union (EU, $11.5 billion, 8.3 percent) (see Figure 2). These top five markets made up 59.4 percent of U.S. total agricultural exports in 2017. 2017 U.S. agricultural exports were up for Japan, Mexico, and Canada, by 8.1 percent, 4.5 and 0.9 percent, percent, respectively, compared with the previous year. On the other hand, 2017 U.S. exports to China and EU where down 8.3 percent and 0.4 percent, accordingly, relative to 2016 (see Figure 2).
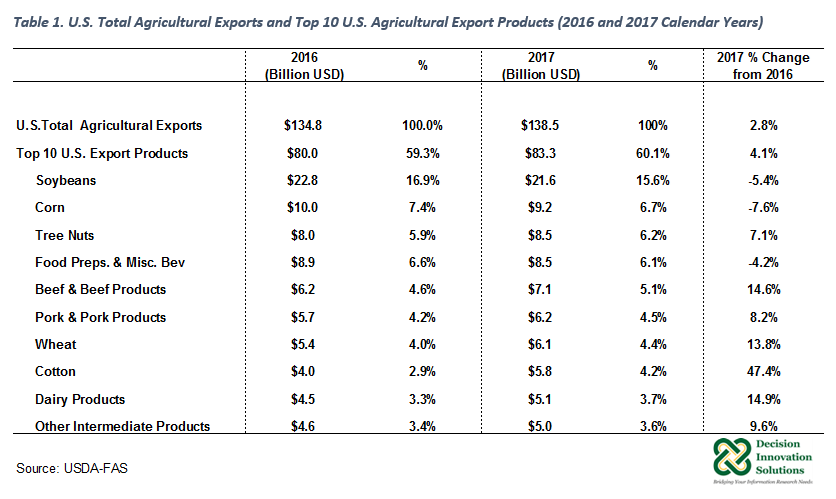
Soybeans were the number one U.S. agricultural export commodity in the 2017 calendar year with a value of $21.6 billion and a share of 15.6 percent of total U.S. agricultural exports. In addition, corn, tree nuts, food preparations & miscellaneous beverages, beef & beef products, and pork & pork products were among the top ten U.S. agricultural export commodities in 2017. Overall, the top ten commodities made up 60.1 percent ($83.3 billion) of total 2017 U.S. agricultural exports (see Table 1).
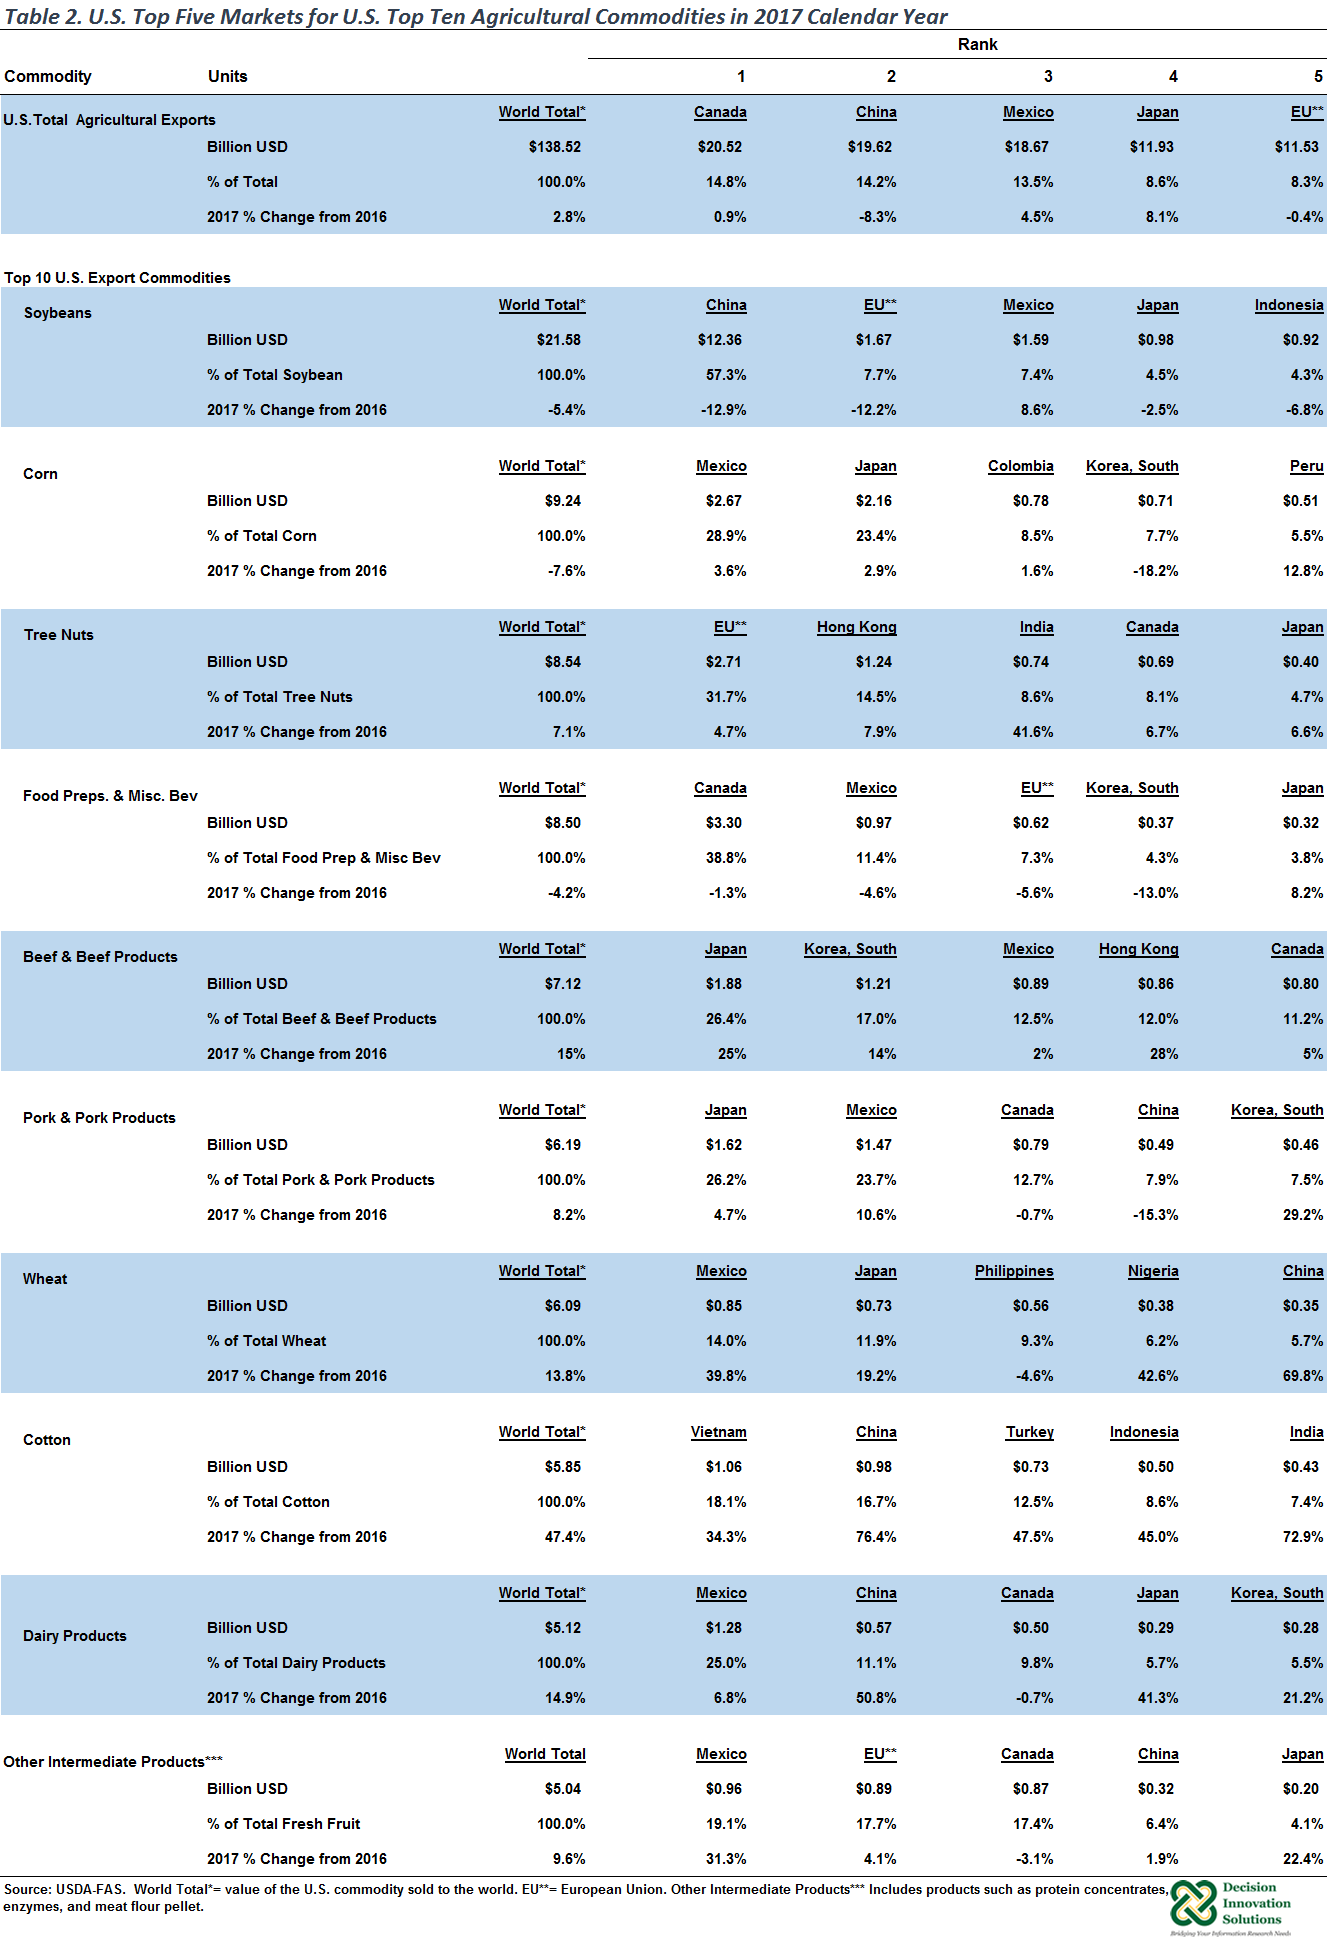
2017 U.S. exports of tree nuts ($8.5 billion), beef & beef products ($7.1 billion), pork & pork products ($6.2 billion) were up 7.1 percent, 14.6 percent, and 8.2 percent year over year, respectively. The top five markets for both U.S. tree nuts and beef & beef products grew in 2017 compared with 2016 (see Table 2). In the case of beef & beef products, the five top markets’ share was 79.1 percent of total U.S. beef & beef product exports. For pork & pork products, U.S. exports to Japan, Mexico and South Korea increased 4.7 percent to $1.62 billion, 10.6 percent to $1.47 billion, and 29.2 percent to $0.46 billion in 2017 relative to 2016 (see Table 2). Despite U.S. pork & pork product export declines to Canada (0.7 percent) and China (15.3 percent) in 2017 from the previous year, U.S. pork & pork product exports registered the second largest value since 2014 ($6.5 billion).
U.S. soybean exports declined 5.4 percent during 2017 calendar year compared with the previous year, reflecting lower U.S. soybean exports to China, the main market for U.S. soybeans. In 2017 U.S. soybean exports to China made up 57.3 percent ($12.4 billion) of U.S. total soybean export value (see Table 2) and 63.0 percent of 2017 U.S. total agricultural products exported to China ($19.6 billion). In addition, exports to EU, Japan, and Indonesia, which in 2017 had 7.7 percent, 4.5 percent, and 4.3 percent share of U.S. total soybean exports, respectively, declined 12.2 percent, 2.5 percent, and 6.8 percent, correspondingly (see Table 2). Among the top five markets for U.S. soybean in 2017, only exports to Mexico were up 8.6 percent to $1.59 billion year over year. The United States is facing a strong competition mainly from Brazil, the global leading exporter of soybeans. Despite last year’s decline, soybeans continued as the main U.S. agricultural export commodity. Since 2000 (except 2006 when corn was the number one U.S. export commodity), soybeans’ share of total U.S. agricultural exports averaged 14.3 percent during the 17-year period.
U.S. exports of corn ($9.2 billion), and food preparations & miscellaneous beverages ($8.5 billion) were down 7.6 percent and 4.2 percent in the 2017 calendar year from their corresponding values in 2016, accordingly (see Table 1). 2017 U.S. corn exports to Mexico ($2.67 billion) and Japan ($2.16 billion), the two largest markets for U.S. corn, were up 3.6 percent and 2.9 percent, respectively, compared with the previous year (Table 2). Exports to these two markets comprised 52.2 percent of total 2017 U.S. corn exports. In addition, 2017 U.S. corn exports to Colombia ($0.78 billion), and Peru ($0.50 billion), the third and fifth largest markets for U.S. corn in 2017, were up 1.6 percent and 12.8 percent, respectively, year over year. Despite U.S. corn exports expansion in these four markets in the 2017 calendar year, total U.S. corn exports declined 7.6 percent last year, reflecting lower export values among other markets and the impact of declining corn price. 2017 U.S. corn exports dropped for South Korea (18.2 percent), Taiwan (13.6 percent), Saudi Arabia (22.1 percent), Venezuela (71.4 percent), Guatemala (16.6 percent), and Egypt (80.8 percent), as well as exports to the rest of the world (20.4 percent). Decline in these markets were large enough to offset U.S. exports increases in major markets such as Mexico, Japan, Colombia, and Peru during the 2017 calendar year. The United States is facing increased competition from Brazil and Argentina, which is hindering U.S. corn exports.
Summary
Canada finished as the number one market for U.S. agricultural exports in the 2017 calendar year, with a total export value above $20 billion, followed closely by China ($19.62 billion) and Mexico ($18.67 billion). Also, important customers for U.S. agricultural products in the 2017calendar year were Japan ($11.93 billion) and EU ($11.53 billion).
Soybeans were the top U.S. agricultural export commodity in 2017, with fifteen percent ($21.58 billion) of total agricultural exports ($138.52). China continued as the number one market for U.S. soybeans, with export value surpassing $12 billion and 52.3 percent share of 2017 U.S. total soybean export value.
Corn was the number two U.S. agricultural export commodity in 2017. U.S. corn exports reached a value of $9.24 billion last year. At $2.67 billion, Mexico remained the top market destination for U.S. corn, closely followed by Japan with $2.16 billion.
In 2017, Iowa produced 2.6 billion bushels of corn, maintaining its position as the top U.S. corn producer. Also last year, Iowa produced 561.6 million bushels of soybeans, and continued as the second largest producer of U.S soybeans, after Illinois. Iowa’s economy benefits greatly given the relevance of corn and soybeans production in the state and the importance of these two commodities in U.S. agricultural exports.
This article is part of a report originally published here.