posted by Jing Tang on Thursday, December 28, 2023
The U.S. Energy Information Administration (EIA) published its Monthly Energy Review report on December 21st, 2023 and its Monthly Biofuels Capacity and Feed Stocks Update Report on November 30th, 2023. In this article, we will conduct a descriptive analysis of pure biodiesel (B100) production and its feedstocks usage.
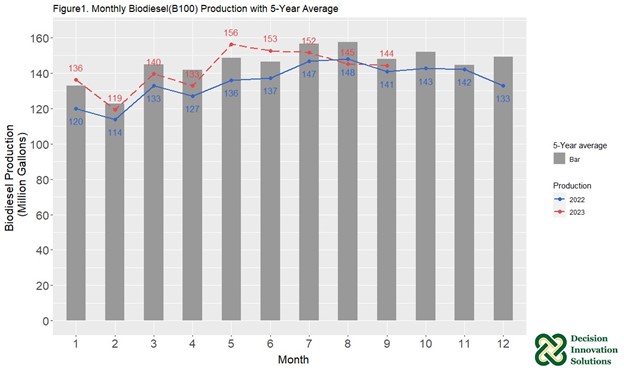
Biodiesel Production and Five-Year Average
EIA reported an average of 142 million gallons of pure biodiesel was produced in January through September 2023, which was 8 million gallons more when compared to the average of these nine months in 2022, and 76 million gallons more compared to the total production in the same time period. In Figure 1, the red dashed line represents the B100 production in 2023. The blue solid line represents the B100 production in 2022. The gray bar represents the 5-year average (2018 to 2022) biodiesel production for each month. Biodiesel production in all 12 months of 2022 was lower than the 5-year average, while biodiesel production in the first nine months of 2023 has begun to increase compared to the 5-year average.
Biodiesel Feedstocks Usage Five Year Outlook
Figure 2 shows the monthly usage of vegetable oils, i.e., canola oil (represented by red color), corn oil (green color) and soybean oil (blue color), in biodiesel production from January 2018 to September 2023. Some data records for canola oil are missing because EIA withheld them to avoid disclosure of individual company data. Soybean oil remains the largest oil input for the entire study period.
For the nine months in 2023, soybean oil inputs to biodiesel production were 9,755 million pounds (42.3% of total feedstock input in 2023), which is 1,965 million pounds more soybean oil input than the same time period in 2022. Canola oil input for biodiesel production was 2,461 million pounds (10.7% of total feedstock input in 2023), which is 1,649 million pounds more canola oil input compared to the same time period in 2022. Corn oil input was 2,840 million pounds (12.3% of total feedstock input in 2023), which is 196 million pounds more corn oil input than the same time period in 2022.
Application of simple linear regression models on vegetable oil inputs across time, results in significantly increasing trends for all three vegetable oil inputs over time, shown in Figure 2. For the last five years, soybean oil is the top feedstock contributor for B100 production even though the percentage of soybean oil input has decreased among all oil inputs, from its highpoint in 2020 of 65.9% to 46.0% in 2022, and to 42.3% in 2023 so far.
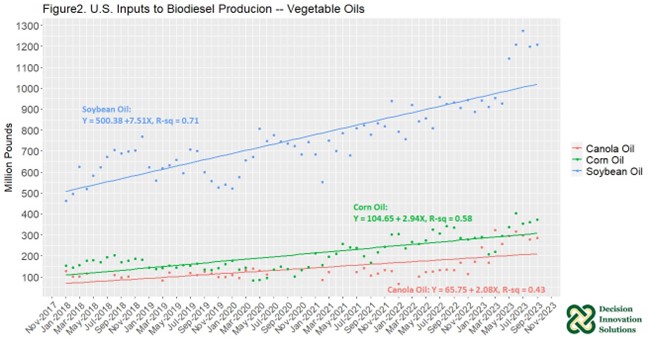
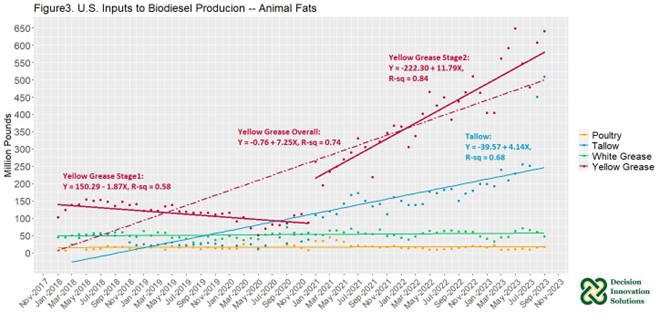
Figure 3 shows the monthly usage of animal fats and recycled feeds, i.e., poultry fat (represented by yellow color), tallow (blue color), white grease (green color, also called choice white grease) and yellow grease (red color), in biodiesel production within the same study period. Again, some data records for poultry fat and tallow are missing because EIA withheld them to avoid disclosure of individual company data.
Yellow grease, which includes recycled cooking oil, is the top animal fats and recycled feeds input to U.S. biodiesel production within the studied period. In the first nine months of 2023, yellow grease usage was 4,883 million pounds, 1,311 million pounds more when compared to the same time period in 2022 and about 2,525 million pounds more when compared to the first nine months of 2021. Yellow grease usage increased 36.7% compared to yellow grease inputs in the same time period in 2022 and increased 107.14% more compared to yellow grease inputs in the same time period in 2021.
For the studied period, tallow input, with 2,536 million pounds, increased 77.1% compared to the same time period in 2022, with 1,432 million pounds, and increased 109.89% more compared to tallow inputs in 2021. Notice that for August and September in 2023, tallow input was 450.6 million pounds and 508.5 million pounds, respectively, which is twice as much as the average tallow input in the first seven months of 2023.
Poultry fat increased 10.0% from 108 million pounds in the first three quarters in 2022 to 119 million pounds in the same time period in 2023. On the other hand, white grease annual input decreased 5.14% from 494 million pounds in the first three quarters in 2022 to 469 million pounds in the first three quarters in 2023.
Animal fats and recycled feeds usage captured about 34.7% of total feedstock usage in the studied period in 2023. Yellow grease accounted for 21.2% of that 34%, followed by tallow with 11.0%, white grease with 2.0%, poultry fat with 0.5%, and with “other” input unknown. The animal fats and recycled feedstock usage increased about 42.82% compared to the first three quarters in 2022, with 2,400 million used.
Yellow grease and tallow inputs have shown increasing trends in biodiesel production. Yellow grease and tallow became the number two and number three fats & oils inputs for biodiesel production since 2021, respectively. Corn oil was the second largest oil input before 2021. Regression models indicate the same conclusion, yellow grease input (for both overall period and stage 2, which is from January 2021 to September 2023), and tallow input have trends which are significantly increasing over the study period shown as the red equation and blue equation respectively in Figure 3. Yellow grease, tallow for biodiesel production could achieve even more significant greenhouse gas emissions reductions compared to plant-based inputs, mainly because they don’t share emissions of upstream activities[1].
In conclusion, although biodiesel production has experienced a slightly decreasing trend, several of the major inputs of biodiesel production are trending upward reflecting a changing contribution among different fats and oils inputs. Yellow grease and tallow have seen a strong increasing trend, and they may become the leading fats & oils inputs for biodiesel production in the future. Other animal fat inputs, such as poultry fat and white grease have seen a decreasing trend. The input share of soybean oil is declining, though the total input of SBO in B100 production is trending up. The percentage of contribution is down 23.6% from 2020 to 2023.
[1] Xu H, Ou LW, Li Y, Hawkins TR, and Wang M, Life Cycle Greenhouse Gas Emissions of Biodiesel and Renewable Diesel Production in the United States, 2022, Environmental Science and Technology.