posted by S. Patricia Batres-Marquez on Thursday, June 29, 2017
U.S. Broiler Production and Exports
The U.S. is the number one broiler producer in the world followed by Brazil, China, and the European Union (EU). In 2016, U.S. production of broiler meat was up 1.6% to 18.262 million metric tons ready-to-cook equivalent (MT RTC) compared with 2015 (17.971 million MT RTC) reaching a new record high (see Figure 1). Based on 2016 slaughter data (measured in metric tons live weight equivalent) of young chicken, which represented 98.5% of total chicken slaughtered in 2016, the top-five U.S. producers were Georgia (13.8%), North Carolina (11.2%), Arkansas (11.2%), Alabama (10.9%), and Mississippi (8.4%). These five states made up 55.6% of total U.S. chicken production (24.511 million MT live weight equivalent) in 2016.
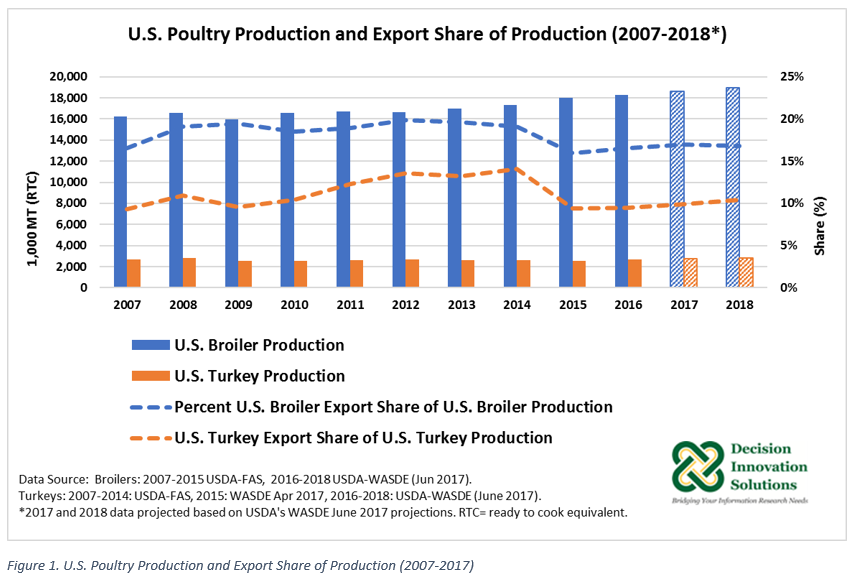
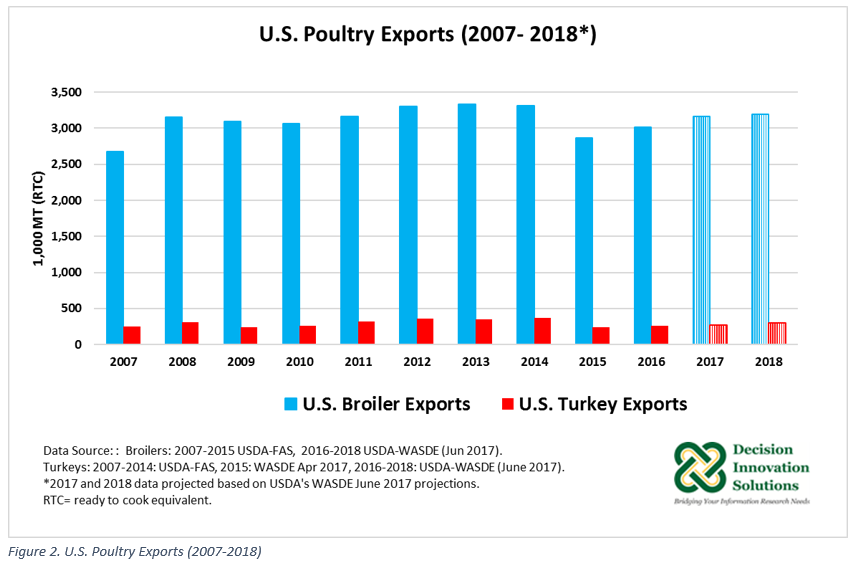
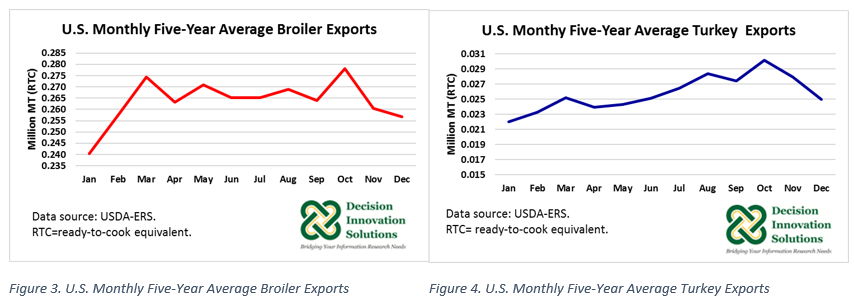
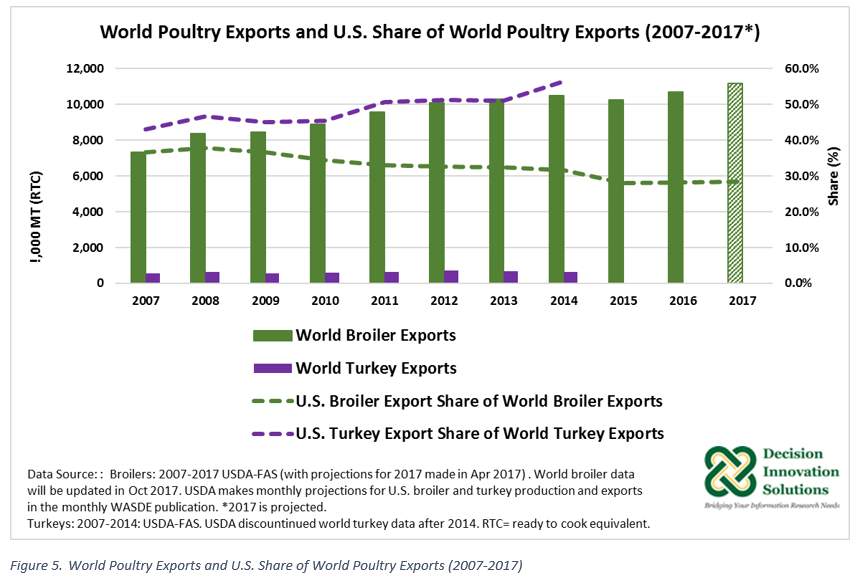
In 2015, the U.S. poultry industry faced several outbreaks of Highly-Pathogenic Avian Influenza (HPAI) affecting mainly table egg layers and turkeys in the Midwestern states. The virus negatively impacted production, trade, and prices. According to USDA-Economic Research Service (ERS), the HPIA outbreak did not impact broiler production but affected its export sector due to the trade restriction brought by the virus, because many countries enacted full or partial bans on poultry products from the United States. 2015 U.S. broiler exports fell 13.4% to 2.867 million MT RTC year over year. Another factor that lower U.S. broiler exports in 2015 was the strength of the U.S. dollar. The U.S. exported 3.015 million MT RTC of broiler meat in 2016 (see Figure 2) representing about 16.5% of 2016 U.S. total broiler meat production (see Figure 1). 2016 U.S. broiler meat exports were up 5.2% from 2015 (see Figure 2). The five-year (2012 to 2016) monthly average indicates U.S. broiler and turkey exports fluctuate seasonally throughout the year. For U.S. broiler exports, the largest sales of each year are registered during March and October. For U.S. turkey exports, the largest sales occur during the month of October (see Figures 3 and 4).
As Figure 5 indicates, in 2016 the U.S. supplied 28.2% of 2016 world broiler meat export volume (10.686 million MT RTC). Globally, the United States was ranked second in broiler exports after Brazil. 2016 Brazil broiler meat exports (3.889 million MT RTC) exceeded the United States’ 2016 broiler export by 0.874 million MT RTC. Brazil’s share of global broiler exports was 36.4% in 2016.
U.S. broiler meat was exported to 143 countries in 2016, with Mexico as the number one destination. Mexico imported 21.1% (0.637 million MT RTC) of 2016 U.S. total broiler exports. Also among the top five destinations for U.S. broiler meat in 2016 were Canada (0.162 million MT RTC, 5.4%), Cuba (0.159 million MT RTC, 5.3%), Hong Kong (0.152 million MT RTC, 5.0%), and Taiwan (0.151 million MT RTC, 5.0%).
USDA’s projections published in the June 2017 edition of World Agricultural Supply and Demand Estimates (WASDE) report indicated U.S. 2017 broiler production up 1.9% to 18.604 million MT RTC year over year (Figure 1). 2017 U.S. broiler exports were forecast around 3.164 million MT RTC, up 4.9% from last year (see Figure 2). According to USDA-ERS data, U.S. broiler exports during the first four months of 2017 were up 5.4% to 1.010 million MT RTC, compared with the same period last year.
USDA data indicates that although exports to Mexico during January to April 2017 declined 11.2% to 0.193 million MT RTC relative to the same period in 2016, Mexico continued as the number one destination for U.S. broilers. Mexico’s share of total U.S. broiler exports from January to April 2017 was equal to 19.1%. Exports to Angola and Cuba have experienced substantial increases so far this year (January to April 2017) with a share of 6.3% each of U.S. total broiler exports.
USDA’s forecast for 2018 U.S. broiler production indicates an increase of 2.0% to 18.971 million MT RTC compared with the forecast for 2017 (see Figure 1). In addition, 2018 broiler exports are forest to rise only 0.8% to 3.189 million MT RTC (see Figure 2). According to USDA-ERS, the small growth in broiler exports next year is due in part to uncertain conditions for economic growth in some key export markets. Overall, there is a positive outlook for both U.S. broiler production and exports in 2017 and 2018, though broiler exports are expected to remain below the 2014 level (see Figure 2).
U.S. Turkey Production and Exports
The USDA-Foreign Agricultural Service (FAS) no longer publishes U.S. and world production and trade data for turkey meat. Historical data available through 2014 from USDA-FAS indicates that in 2014 the United States exported 56.6% of world turkey exports (0.647 million MT RTC) (see Figure 5). The United States produced 2.6 million MT RTC of turkey meat in 2014. The U.S. turkey export share was 14.1% (0.366 million MT RTC) of 2014 U.S. turkey production (see Figure 1).
The USDA-World Agricultural Outlook Board (WAOB) continues publishing U.S. turkey production and trade data in the monthly WASDE report. WASDE data indicates 2015 U.S. turkey production declined 1.8% to 2.552 million MT RTC year over year (see Figure 1). 2015 U.S. turkey exports dropped 34.4% to 0.240 million MT RTC compared with the previous year (see Figure 2). In 2015 U.S. turkey production and exports were negatively impacted by HPAI, causing both production and exports to fall.
The June 2017 WASDE report indicated the United States produced 2.713 MT RTC of turkey meat and exported 9.5% (0.258 million MT RTC) of this production in 2016. Both 2016 U.S. turkey production and exports were up compared with 2015 (see Figure 1 and Figure 2). 2016 turkey production surpassed that in 2014 but exports remained below 2014 exports (0.366 million MR RTC).
Based on 2016 slaughter data (measured in metric tons live weight equivalent) of young turkey, which represented 99.3% of total turkey slaughtered in 2016, the top five U.S. turkey producers in 2016 were Minnesota (15.8%), Indiana (11.5%), North Carolina (11.3%), Virginia (10.0%), and Arkansas (9.9%). These five states comprised 58.5% of 2016 total U.S. turkey production (3.362 million MT live weight equivalent). In 2016, Iowa was the sixth largest turkey producer in the United States, with 7.6% (0.257 million MT live weight equivalent) of total U.S. 2016 turkey production. 2016 Iowa turkey production was up 22.7%% from 2015 (0.209 million MT live weight equivalent).
As with broiler meat, the main destination for U.S. turkey meat in 2016 was Mexico, importing 59.2% (0.152 million MT RTC) of U.S. total turkey meat exports last year. Eighteen percent (18.2%) of 2016 U.S. total turkey exports were shipped to four other markets: Hong Kong (0.024 million MT RTC, 9.4%), Japan (0.010 million MT RTC, 3.7%), Dominican Republic (0.008 million MT RTC, 3.0%), and Canada (0.005 million MT RTC, 2.1%). January to April 2017 data indicates US. turkey exports reached a volume of 0.08 million MT RTC up 9.6% compared with the same period last year. U.S. exports to Mexico rose 19.8% to 0.05 million MT RTC from January to April 2017, relative to the same period in 2016, and represented 64% of total U.S. turkey exports during the first four months of 2017.
U.S. broiler production set a record high in 2016 and is expected to continue this upward trend in 2017 and 2018. 2016 U.S. turkey production was the largest since 2008. Also, turkey production is expected to continue growing in 2017 and 2018. Both 2016 U.S. broiler and turkey exports surpassed volumes of exports in 2015, the year of the HPAI outbreak. Despite forecasts indicating U.S. broiler and U.S. turkey export expansions in 2017 and 2018, compared with their corresponding levels in 2016, the forecasts remain below 2014 levels.
- broilers
- exports
- poultry