posted by S. Patricia Batres-Marquez on Monday, July 23, 2018
U.S. Corn Export Projections for 2017/18 and 2018/19
July 2018 World Agricultural Supply and Demand Estimates (WASDE) report published by USDA, contains the latest forecast for 2017/18 U.S. corn exports. Based on recent trade activity, the projection indicates 2.400 billion bushels of corn would be sold overseas during the current marketing year. This projection is up 100 million bushels from last month’s projection. Large competitors’ market conditions have benefit U.S. corn exports. For instance, according to USDA, Brazil has reduced corn shipments while favoring soybean exports in response to strong foreign demand. Argentina’s hot and dry weather conditions at the beginning the year resulted in lower production. From this, higher price has reduced Argentinean corn competitiveness compared with U.S. corn. The latest forecast indicates U.S. corn exports would be the second-largest since the 2007/08 marketing year (2.437 billion bushels), or if comparison is based on the trade year (TY), exports would be the second largest since 1979/80 (2.433 billion bushels) (see Figure 1). TYs are used to compare all countries’ trade. Commodities follow a common 12-month period, which in the case of corn, it goes from October to September.
Although 2018/19 corn exports are forecast down 175 million year-over-year, exports are expected to continue a strong pace in 2018/19 marketing with a forecast volume of 2.225 billion bushels. The forecast was increased by 125 million bushels from June 2018.
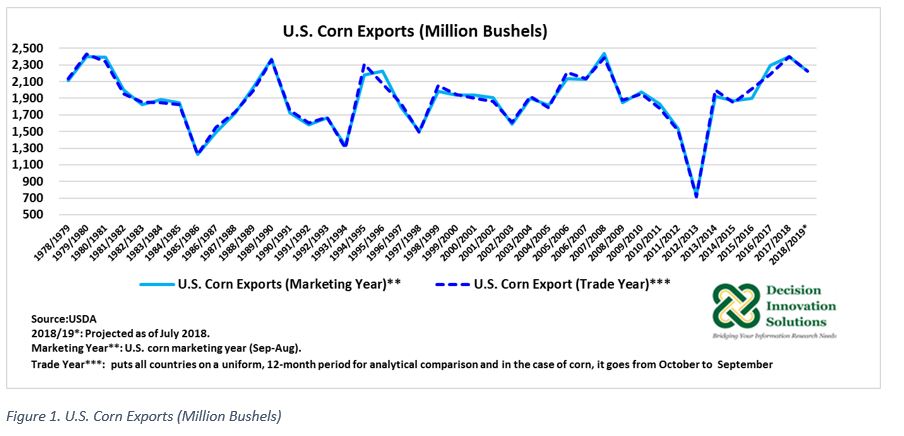
Figure 1. U.S. Corn Exports (Million Bushels)
Update on U.S. Corn Export Sales through the 45th Week of 2017/18
According to export data published by USDA-FAS on July 19, 2018, U.S. corn net sales[1] during the week ending July 12, 2018, were up 59.4 percent to 25.2 million bushels (640,997 metric tons) compared with the previous week. Weekly export sales[2] during the 45th week of the 2017/18 marketing year (50.90 million bushels) were down 7.4 percent week-over-week (54.98 million bushels) (Figure 2).
Back in January 2018, USDA corn export forecast for 2017/18 was much smaller (1.925 billion bushels). As Figure 2 indicates, at the beginning of the marketing year, corn exports were outpaced almost every week compared with the previous year. Weekly exports started to increase after April, hence the latest forecast is up by 300 million bushels from the January forecast.
Accumulated[3] corn exports through the 45th week of the 2017/18 marketing year (1.884 billion bushels), were down 1 percent year-over-year (1.901 billion bushels). Outstanding sales[4] (428 million bushels) were up 45.6 percent relative to the first 45 weeks of the 2016/17 marketing year (294 million bushels) (see Figure 2). With this level of accumulated exports and outstanding sales, total commitments[5] by July 12, 2018, were up 5.3 percent to 2.312 billion bushels relative to the same period during the previous year (2.195 billion bushels). Relative to total commitments by the 45th week of 2015/16 (1.887 billion bushels), current marketing year total commitments were up 22.6 percent (Figure 3). Based on this data, there is an 88 million-bushel difference between the 2017/18 export projection and export total commitments (as of the 45th week of 2017/18). Twelve (12.57) million bushels per week until the end of the marketing year are needed to meet the projection; however, no outstanding sales cancellation should occur in the meantime.
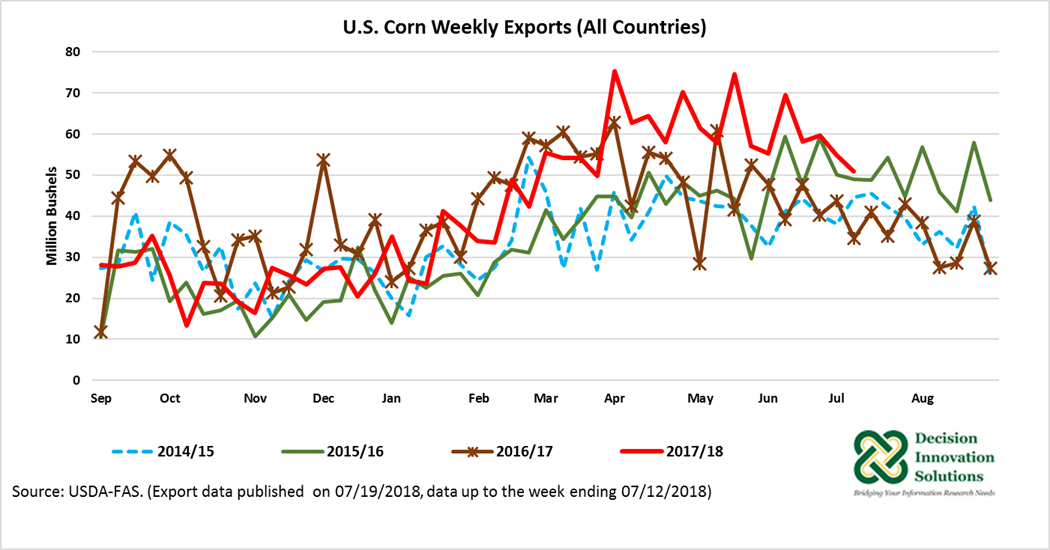
Figure 2. U.S. Corn Weekly Exports (All Countries)
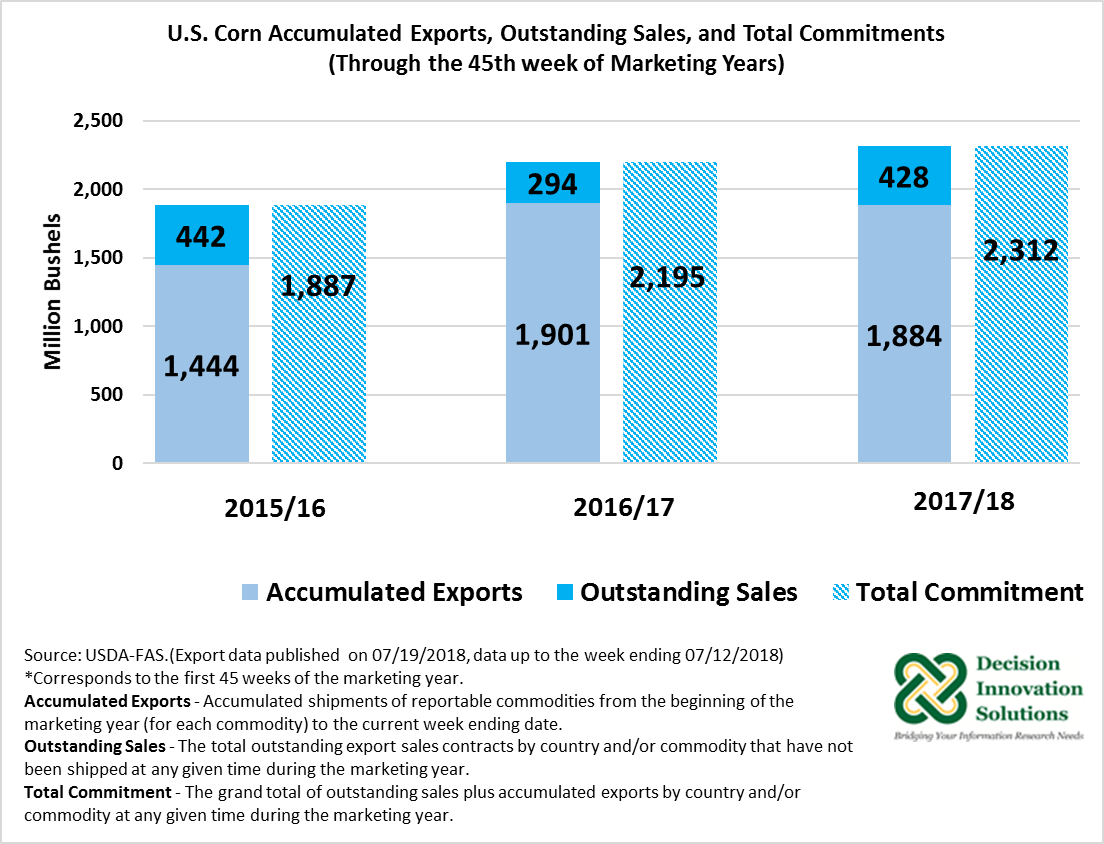
Figure 3. U.S. Corn Accumulated Exports, Outstanding Sales, and Total Commitments (Through the 45th week of Marketing Year)
Figure 4 shows a summary of accumulated and outstanding exports for key U.S. corn markets (Mexico, Japan, South Korea, Colombia, Peru, and Taiwan). As of July 12, 2017, total commitments were up for Mexico (10 percent to 584 million bushels), Colombia (8 percent to 178 million bushels), and Peru (5 percent to 122 million bushels). U.S. corn export total commitments were down for the second-largest importer of U.S. corn, Japan (2 percent to 444 million bushels). in addition, total commitments were down for South Korea (1 percent to 219 million bushels) and Taiwan (20 percent to 92 million bushels).
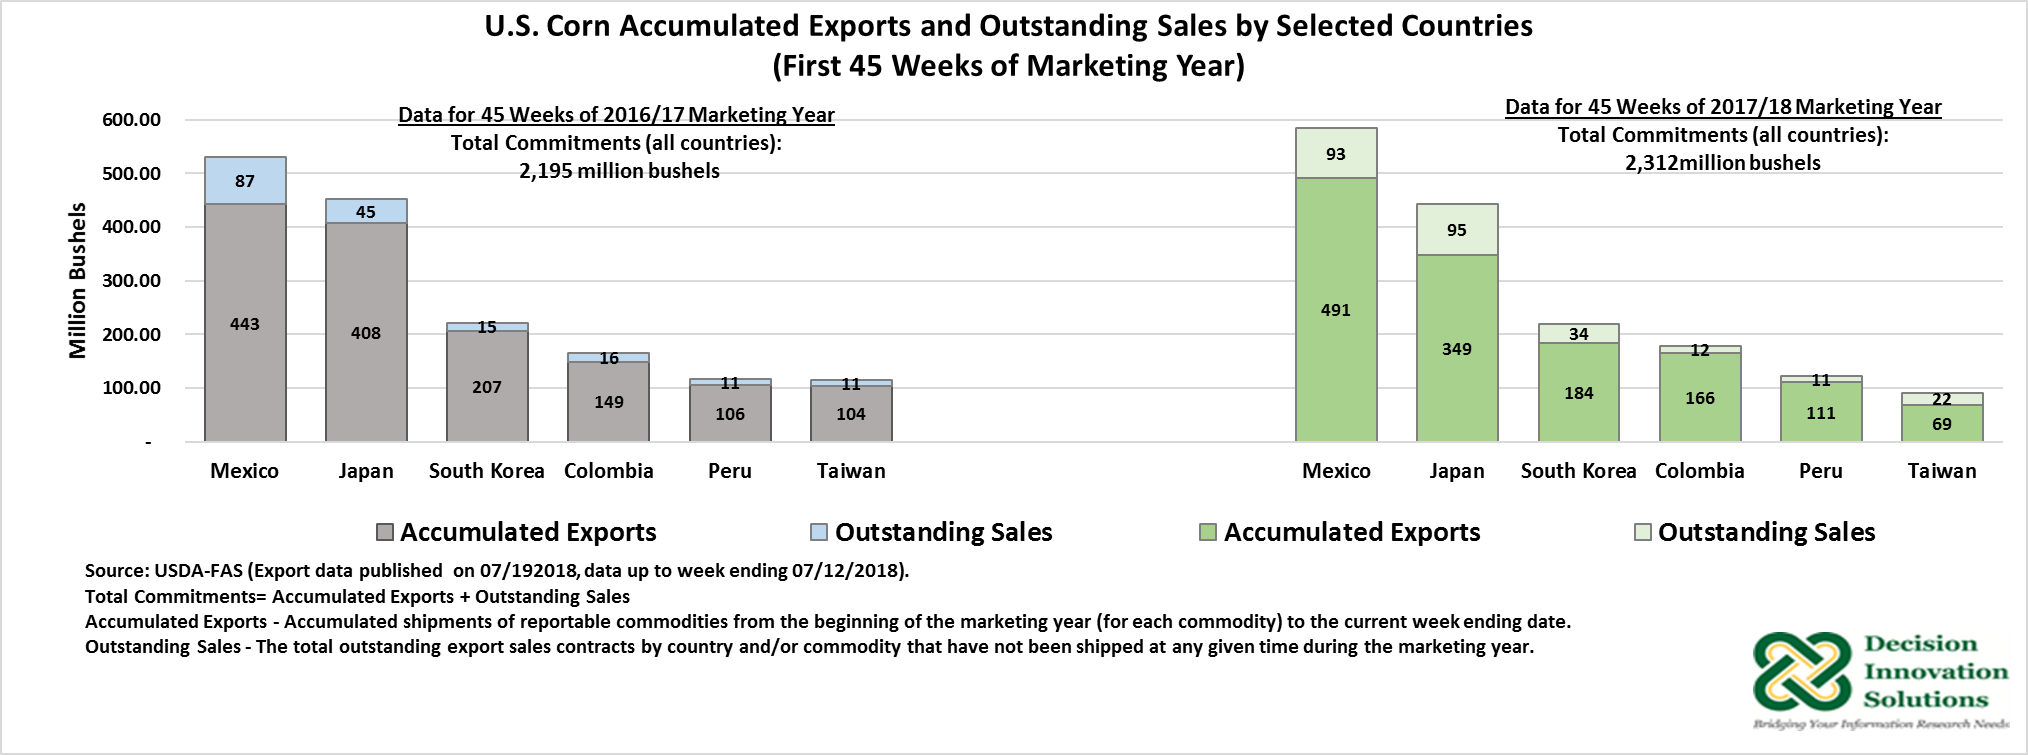
Figure 4. U.S. Corn Accumulated Exports and Outstanding Sales by Selected Countries (First 45 Week of Marketing Year)
[1] Net Sales or Net Changes - The sum total resulting from new export sales, increases resulting from changes in destination, decreases resulting from changes in destination, decreases resulting from purchases from foreign sellers, and cancellations resulting from contract adjustments, buybacks, loading tolerances, changes in marketing year, or change in commodity.
[2] Weekly Exports - Shipments of reportable commodities exported against sales for a reporting week Friday through Thursday.
[3] Accumulated Exports - Accumulated shipments of reportable commodities from the beginning of the marketing year (for each commodity) to the current week ending date.
[4] Outstanding Sales - The total outstanding export sales contracts by country and/or commodity that have not been shipped at any given time during the marketing year.
[5] Total Commitment - The grand total of outstanding sales plus accumulated exports by country and/or commodity at any given time during the marketing year.
This article was originally published here: https://www.iowafarmbureau.com/Article/USDAs-201718-Corn-Export-Forecast-SecondLargest-on-Record