posted by Jing Tang on Friday, January 25, 2019
Our last article has emphasized that a good understanding of corn and soybean yields are important for the State of Iowa. So, we conducted a series of studies to analyze how to utilize crop condition ratings for forecasting Iowa corn and soybean yield. From the last article we know using the Final Crop Good and Excellent Condition Ratings to forecast Corn and Soybean Yield for the State of Iowa is a good approach. The final good and excellent condition ratings explained about 62% of the total variation in the Iowa corn Trend Adjusted (TA) yield and 84% of the variation in Iowa soybean TA yield.
The next question is, when can the good and excellent condition ratings in the growing season start being valuable and useful. In this article, we will demonstrate when should we start utilizing crop good and excellent condition ratings to forecast crop Trend Adjusted (TA) yield for the State of Iowa. The corn and soybean weekly crop progress condition ratings during the growing season were downloaded from USDA-NASS. We used the good and excellent condition ratings of each week to predict the TA yield for Iowa corn and soybeans, since the first week of the growing season was reported from USDA. For example, we used the corn and soybean good and excellent condition ratings in the Week #25 of all the years in the study period, from 1986 to 2018, to estimate the corn and soybean TA yield, respectively, and repeated this step for all weeks. Since the first week and the final week are not identical for all the years, in order to minimize the number of missing weeks, we only looked at the actual first week, actual final week for each year, and the Week from #23 up to #40 for the corn analysis; while for the soybean part, we looked at the actual first week, actual final week for each year and the Week from #24 to #40.
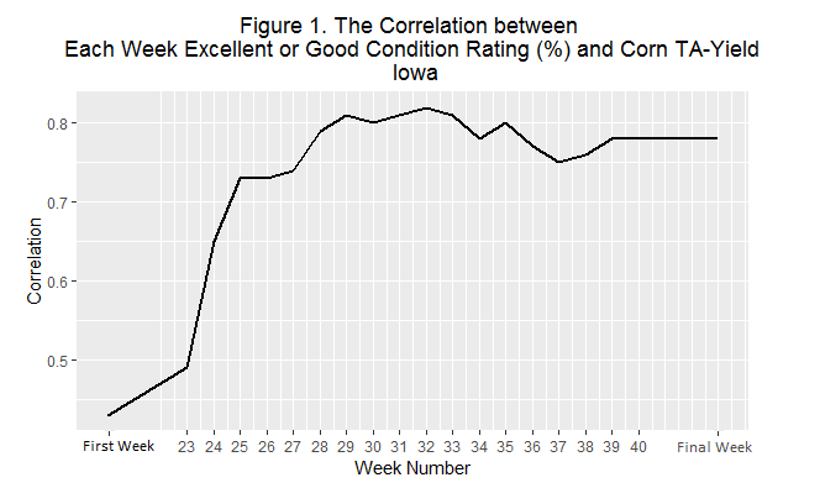
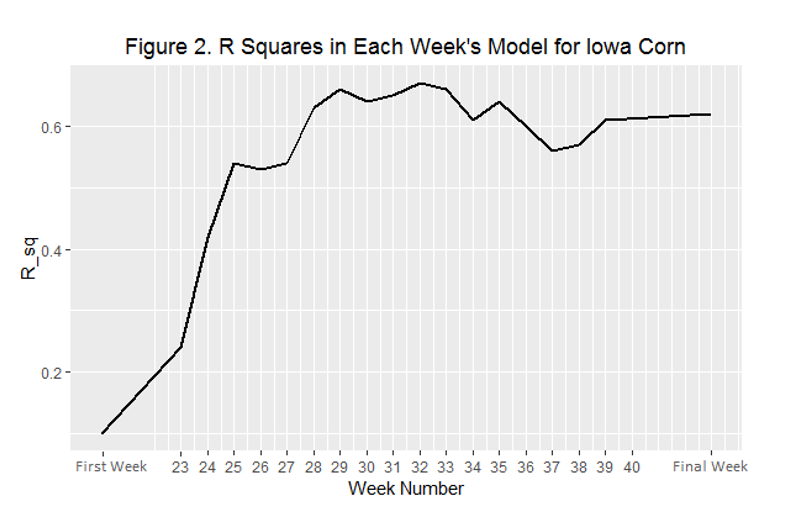
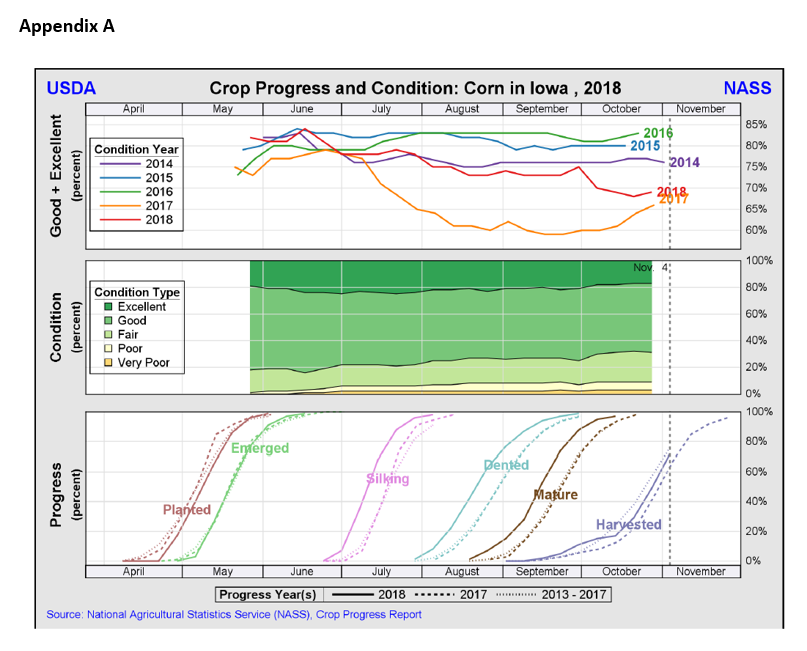
The correlation between each week’s good and excellent condition ratings and Iowa corn TA yield is shown in Figure 1. And in Figure 2, it shows the R square in each week’s linear regression model for Iowa corn. These two criteria, correlation and R square, are corresponding to each other. The higher correlation will lead to a higher R square, that means the condition ratings could explain more variation from the TA yield. Before the week of 25 the slopes in both plots increase rapidly, from Week #28 to Week #35, the shapes in both plots are relative stable, and there is a slight drop down from Week #35 to Week #39, then stay as a constant. At Week #32, the correlation between weekly good and excellent condition ratings and Iowa corn TA yield has the highest value, 0.82, which means they are 82% correlated to each other. The R square has the highest value, 0.67, in the same week, meaning the linear model of Week 32 explains 67% total variation of the Iowa corn TA yield. The week of 32 is around the first week of August, usually the end of Iowa corn silking step and starting to be dented, shown in Appendix A, from USDA NASS crop progress reports.
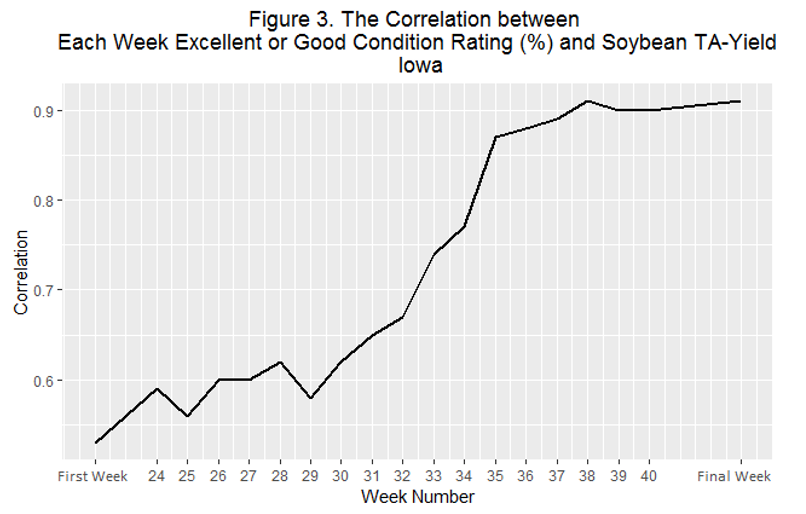
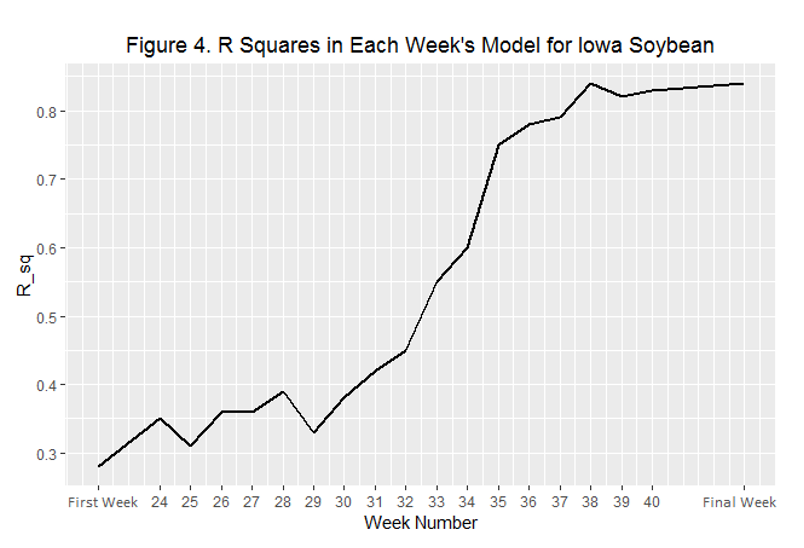
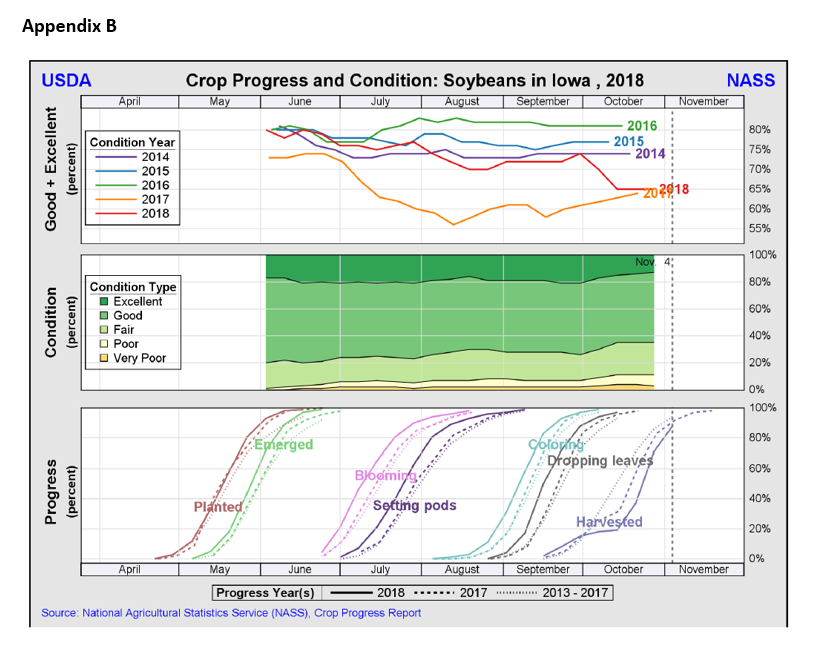
The correlation between each week’s good and excellent condition ratings and Iowa soybean TA yield is shown in Figure 3. And Figure 4 shows the R square in each week’s linear regression model for Iowa soybeans. The shapes in these two figures are almost identical. The highest correlation between weekly good and excellent condition ratings and Iowa soybean TA yield shows in Week #38 and the final week, 0.91, which means the correlation between good and excellent ratings and the soybean yield is 91%. And the highest value of R square shows in Week #38 and the final week as well, 0.84, explains 84% of total variation of the soybean yield model. The week of 38 is around of mid-September, the corresponding stages of Iowa soybean growing are shown in Appendix B.
Theoretically speaking, the correlation and R square are supposed to be increasing and reach the largest value in the final week of the growing season for both corn and soybeans analyses. The two criteria followed the pattern as we expected for soybeans. However, for corn, we observed the highest values of both criteria shown in the week of 32. The correlation dropped from 0.82 to 0.78, and the R square decreased 0.02, from Week #32 to the final week. It could because of the hot summer weather [1, 2], or some other reasons we haven’t realized. We need to dig more into this information in future studies.
The question at the beginning of this article is when will the combination of good and excellent condition ratings be useful to forecast the crop TA yield? If the “useful” means the ratings provide a relative accurate TA yield prediction, then the straightforward answers to it are from the week of 32 and from the week of 38, for corn and soybeans respectively. The condition ratings in the earlier growing season also cover some “useful and valuable” information about the TA yield for both corn and soybeans, just not as much as the ratings in the later season [3].
Reference
[1] Scott Irwin and Darrel Good, Uncertainty About 2016 U.S. Average Corn and Soybean Yields Persists, Farmdoc Daily (6): 132., July 14, 2016
[2] Scott Irwin and Darrel Good, Hot July Weather and Corn Yield, Farmdoc Daily (1): 112., July 19, 2011
[3] Scott Irwin and Darrel Good, When Should We Start Paying Attention to Crop Condition Ratings for Corn and Soybeans, Farmdoc Daily (7): 96., May 24, 2017
This article was originally published here: https://www.iowafarmbureau.com/Article/Utilizing-Crop-Progress-Good-and-Excellent-Condition-Ratings-for-forecasting-Iowa-Corn-and-Soybeans-Yield-Part-2