posted by Jing Tang on Wednesday, January 23, 2019
US corn and soybean production in 2018 is estimated to be 14.6 billion bushels and 4.6 billion bushels, respectively. Iowa is ranked first in the United States for corn production and second in soybean production according to the UDSA State Ranking Report published in May 2018. For the year of 2018, corn production in Iowa is estimated to be 2.5 billion bushels and soybean production is estimated to be 580 million bushels, based on USDA-NASS estimates. The share of corn production is 17.3% of the U.S. total corn production, and the share of soybean production is 12.5% of the U.S. total production. Therefore, to have a good understanding of corn and soybean’s yields are vital, especially for Iowa.
However, there are a lot of uncertainties inherent in assessments when using crop conditions to forecast the corn and soybean yield. There are good articles from Farmdoc daily [1, 2] discussing the relationship between trend adjusted yield and the final crop progress condition ratings, but this approach has only been applied at the national level. So, the purpose of this series of articles is the how and when of utilizing crop progress condition rates to forecast corn and soybean yields for the State of Iowa. In this first article, we will discuss whether the method is appropriate for the State of Iowa.
Recently, the crop progress condition report for the year of 2018, has been fully updated by USDA. We will use the final good and excellent crop condition ratings of the season in the forecasting model, from 1986 to 2018. A brief definition of general crop condition from the crop progress condition report is below. And the percentages in each of the five categories must sum to 100.
- Very Poor - Extreme degree of loss to yield potential, complete or near crop failure. Pastures provide very little or no feed considering the time of year. Supplemental feeding is required to maintain livestock condition.
- Poor - Heavy degree of loss to yield potential which can be caused by excess soil moisture, drought, disease, etc. Pastures are providing only marginal feed for the current time of year. Some supplemental feeding is required to maintain livestock condition.
- Fair - Less than normal crop condition. Yield loss is a possibility, but the extent is unknown. Pastures are providing generally adequate feed but still less than normal for the time of year.
- Good - Yield prospects are normal. Moisture levels are adequate and disease, insect damage, and weed pressures are minor. Pastures are providing adequate feed supplies for the current time of year.
- Excellent - Yield prospects are above normal. Crops are experiencing little or no stress. Disease, insect damage, and weed pressures are insignificant. Pastures are supplying feed in excess of what is normally expected at the current time of year
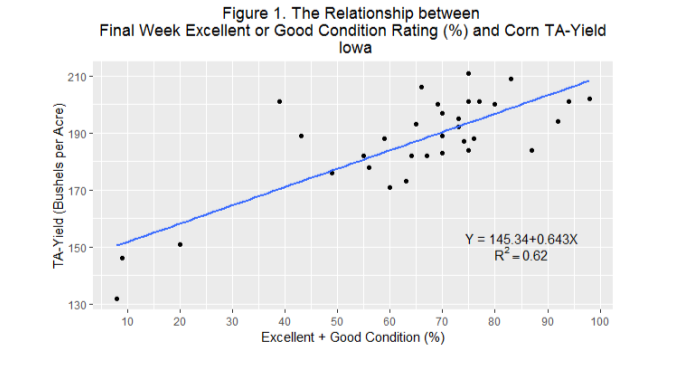
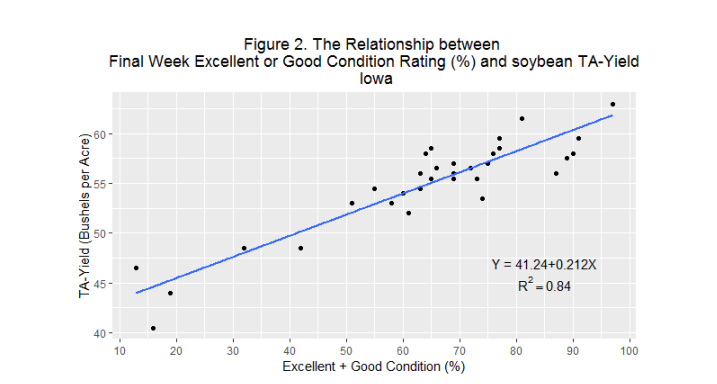
In this analysis, we are only examining the relationship between the final Good plus Excellent condition ratings and the Trend Adjust Yield (TA-Yield), where the trend adjustment factor is set to 2 bushels, as we mentioned in a previous article. The study time period for the analysis is from 1986 to 2018P. Results for Iowa corn TA-Yield and Iowa soybean TA-Yield are shown in Figure 1 and Figure 2, respectively. Comparing the R squares to the national studies, it decreases from 0.85 to 0.62 in the corn yield prediction model, and it increases from 0.71 to 0.84 in the soybean yield prediction model. That means our model fits better for soybean yield prediction but is less accurate for corn yield prediction.
The possible reasons for less accuracy in the corn yield model are: first, in the Iowa corn data, there is more skewness in the final Excellent and Good condition ratings. For Iowa data, the three minimum final Excellent and Good condition ratings are 9% in 1988, 8% in 1993 and 20% in 2012; while the two minimum final Excellent and Good condition ratings in the national study is 19% in 1988 and 25% in 2012; second, there are two unexpected high yield points (in the year 1986 and 2003, respectively) showing up in Iowa when the Excellent plus Good condition ratings are around 40%. Therefore, this model is not a good fit when the final Excellent and Good condition ratings are small, in this case, less than 45%.
Next, we’d like to demonstrate the prediction errors for the two linear regression models above, in order to have a better understanding of forecasting the crop TA yields. The prediction errors are calculated as the actual yield minus the predicted value, shown in Figure 3 and Figure 4 for corn and soybeans, respectively.
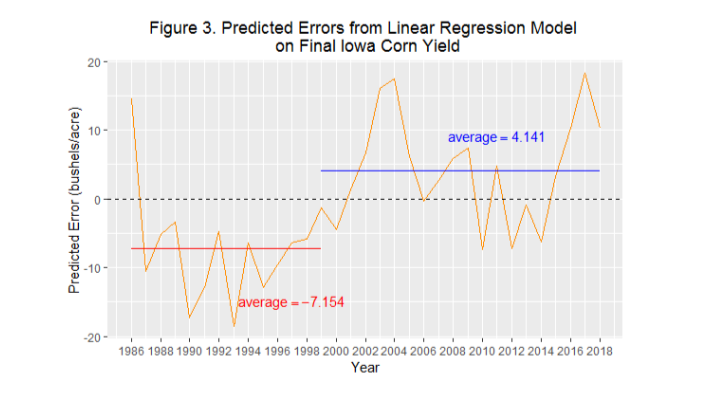
In Figure 3 (corn), there is a large variation in predicted error, ranging from 18.23 bushel under-estimated in 2015 to -18.48 bushel over-estimated in 1993. On average, the model under estimated 4.14 bushels after 1999, and over estimated 7.15 bushels before 1999. In the next article, we will discuss why we pick the year of 1999 as the cutoff point. The standard error for the linear regression model is 8.156 bushels, which is a measurement of prediction uncertainty, that means, we are 95% confident the final corn TA yield will be in the range of the prediction plus/minus 8.156 bushels. We noticed that before the year of 1999, almost all of the predictions are over-estimated, while after the year of 1999, the majority of the predictions are under-estimated.
.PNG)
In Figure 4 (soybeans),the predicted errors range from a 3.457 bushels under-estimate in 2018 to a 4.137 bushels over-estimate in 2003. On average, the model under estimated 0.139 bushels after 1999, and over estimated 0.207 bushels before 1999. The standard error of the linear regression model is 1.94 bushels. So, we are 95% confident the final soybean TA yield will be in the range of the prediction plus/minus 1.94 bushels. The predicted errors shown in figure4 doesn’t show the same pattern as before and after the year of 1999, but the averages of predicted errors in the soybean model have the same sign as the averages of predicted errors in the corn yield model.
So far, the method of forecasting corn and soybean TA yields based on the final progress condition ratings has been tested for the State of Iowa. The corn yield forecasting model has a relative larger predicted error compares to the national study, from Farmdoc daily, with the standard deviation at 8.156 bushels, compares to the standard deviation 4.6 bushels. For soybean yield forecasting, the standard deviation of predicted errors, 1.94 bushels, is similar to the national study, in which the standard deviation was 1.5 bushels. “Crop conditions provide a useful and simple method of forecasting yield, but is should be used with caution and an understanding of the large amount of error present in forecasts”, said by Scott Irwin and his coworkers.
Reference:
[1] Scott Irwin and Darrel Good, How Should We Use Within-Season Crop Condition Ratings for Corn and Soybeans, Farmdoc Daily (7): 101., June 1, 2017.
[2] Scott Irwin and Todd Hubbs, Measuring the Accuracy of Forecasting Corn and Soybean Yield with Good and Excellent Crop Condition Ratings, Farmdoc Daily (8): 118., June 27, 2018.
This article was originally posted here:https://www.iowafarmbureau.com/Article/Utilizing-Crop-Progress-Good-and-Excellent-Condition-Ratings-for-forecasting-Iowa-Corn-and-Soybeans-Yield-Part-1