posted by Jing Tang on Thursday, August 29, 2019
Many midwestern states, like Iowa, Missouri, Illinois, etc., are reliant upon infrastructure to move agricultural and agricultural related commodities to markets. There are thousands of miles of state highways and paved county highways that are integral to the farm and grain handling facilities. Midwestern states provide a solid network of first handlers for local farm grains and oilseeds and aggregation functions for supplying corn, grain sorghum, wheat and soybeans to processors, millers, feed mills and export loading facilities on a year-round basis. The goal of this paper is to demonstrate how those commodities (corn, grain sorghum, wheat, and soybeans) flow from producers to markets.
To simplify, we used the state of Missouri as an example. The methodology can be applied to any other states. Data used in this analysis was downloaded from USDA-NASS, USDA-AMS, Bureau of Transportation Statistics, and Freight Analysis Framework (Version 4). The definitions of commodities (identified by SCTG code) and transportation modes are defined by commodity flow survey (CFS) 2012.
Figure 1 shows Missouri annual agricultural commodities flowed within Missouri from 2013 to 2016. There were 51.29 million tons of agricultural commodities traded within Missouri in 2016. The largest annual shipment category within Missouri was cereal grains accounting for nearly 57 percent, followed by other agricultural products (16%), animal feed (13%), fats and oils (11%) and milled grain products (3%).
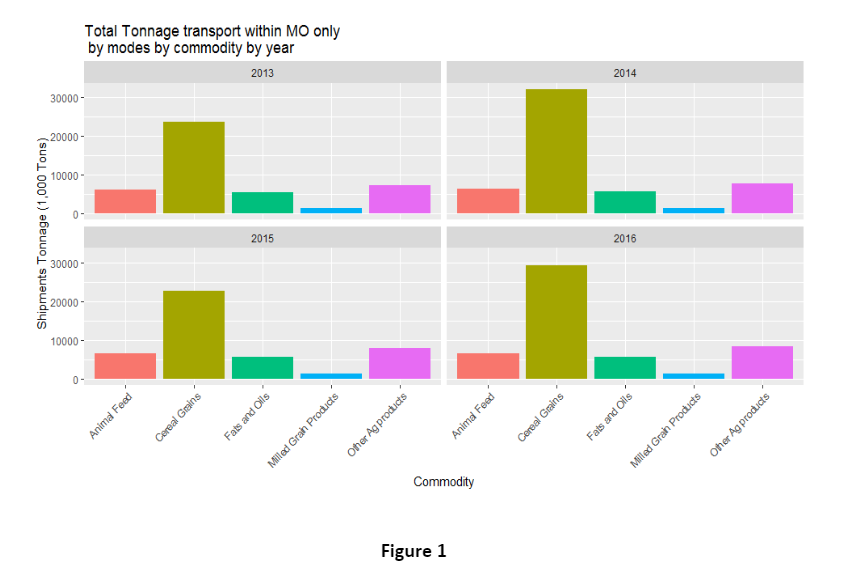
Figure 2 shows the proportion of each transportation mode used for the agriculture commodities flow within Missouri. Trucking was the major transportation mode for all the commodity categories, except for the cereal grains, whose transportation modes are evenly distributed.
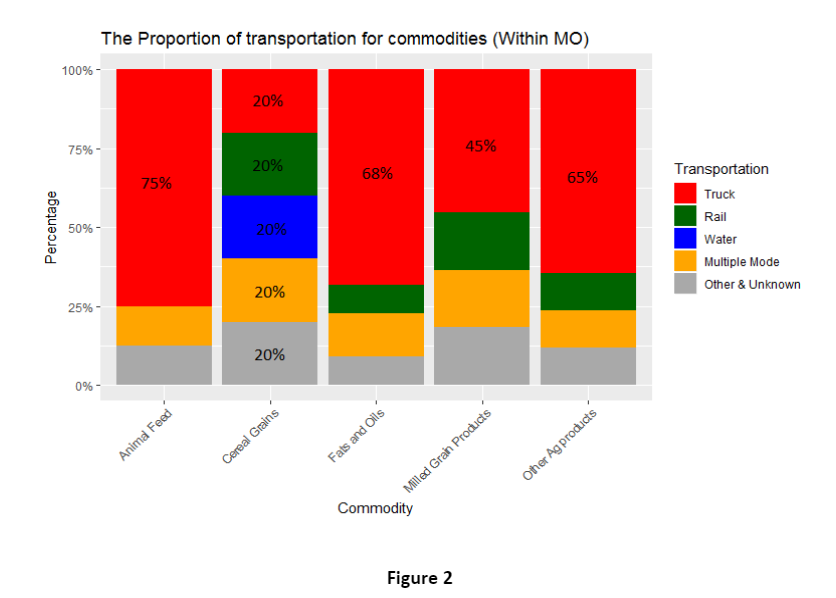
Figure 3 and Figure 4 show the annual agricultural commodities flowed from Missouri to other states, and/or other countries within the 2013 to 2016 period. Cereal grains is the top commodity transported from Missouri to other states with 16.97 million tons in 2016, followed by fats and oils, which accounted for 6.59 million tons in 2016. The top mode of transportation for cereal grains is rail, but for all other commodities, the top mode of transportation is truck.
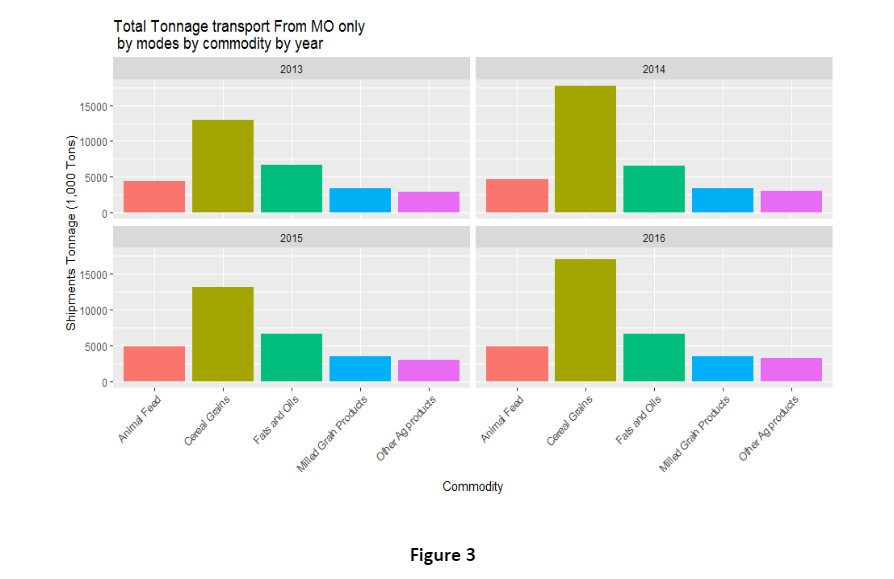
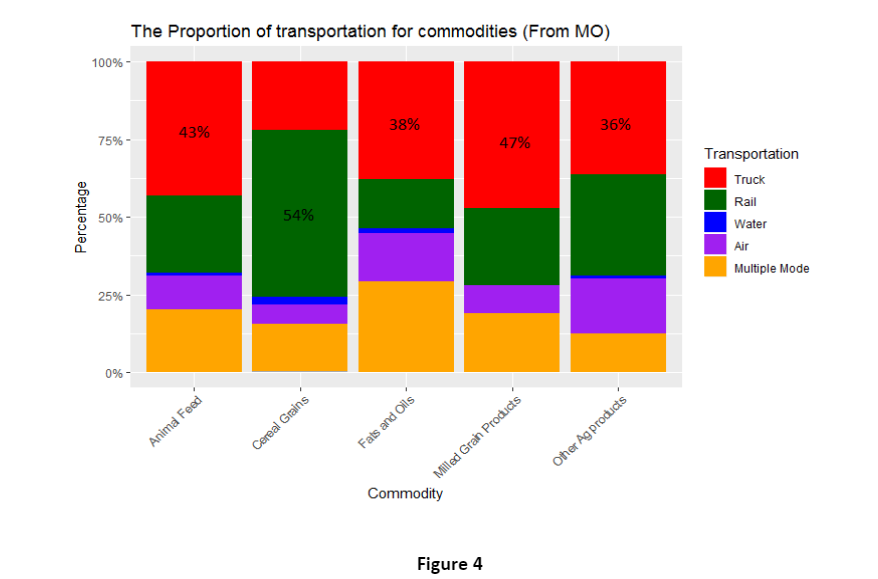
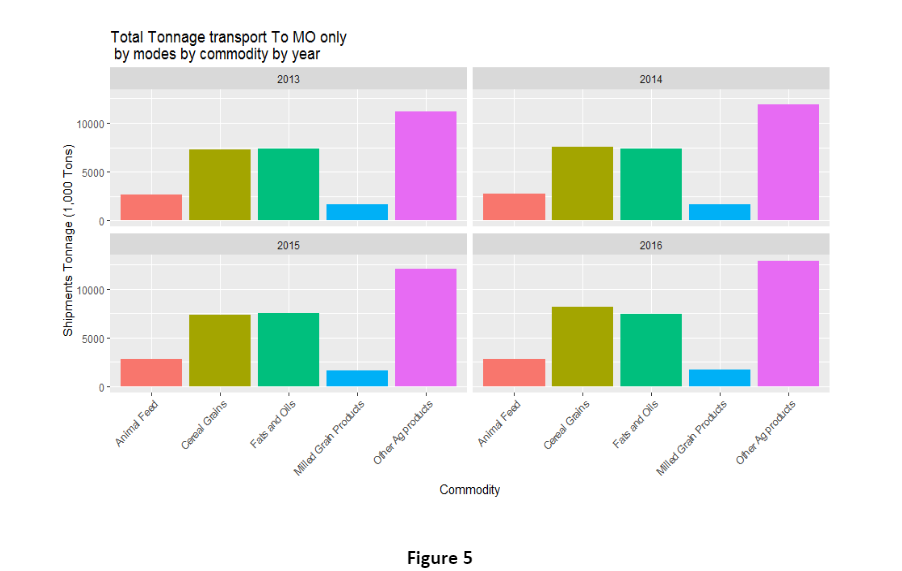
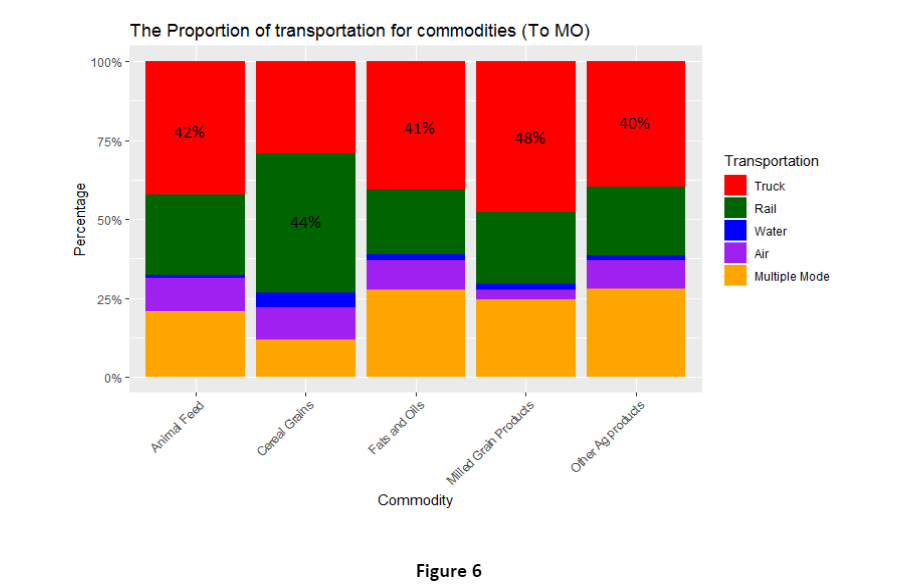
Figure 5 and figure 6 show the agriculture commodities flowed from other states, and/or other countries to Missouri. Other agricultural products, 12.8 million tons in 2016, (defined as Vegetables, fruits, fresh-cut flowers, plants, and other agricultural products, from commodity code manual, CFS 2012) is the top commodity transported to Missouri. Similar to the commodity flow From Missouri, the top transportation mode for cereal grains is rail, while for other categories, the top transportation mode is truck.
We also conducted a series of outflow and inflow analyses for corn, soybeans, wheat and grain sorghum for the State of Missouri, with county level data. For instance, how the grains move to processors, millers, feed mills and ethanol plants, etc., and which the supply grain point(s) move their surplus grains to deficit demand counties.
Click here for more information on the Missouri Commodity Flow study, or if you’d like to have it completed for your state, please contact us.