

Two types of analysis we frequently do are economic impact studies and economic contribution studies. But what exactly is the difference between an impact and a contribution study? Both methods of analysis are commonly done using the IMPLAN modeling system and use similar terminology. For example, both types of analysis include direct, indirect, and induced effects1 and are commonly reported using terms such as output, value added, labor income, and employment. Despite these similarities, though, impact and contribution studies are actually quite different in methodology and results.
An economic impact analysis looks at a change to the economy of a given area. This is generally the entry, exit, expansion, or contraction of a business. A contribution analysis looks at the status and relationships of a currently existing industry (or industries). In terms of differences within the economic model, the primary difference between the two types of analysis is that industries in an impact analysis are allowed to demand from themselves (and therefore have an indirect/induced effect on themselves), whereas in a contribution analysis they are not.
This “self-demand” may seem odd at first glance, but (especially at the individual firm level) there are many situations where it can make sense. For example, the entrance of a new wheat farm in a county would clearly cause a positive direct effect to that county’s grain farming sector from the production of wheat, but the new farm would also need to purchase wheat for seed. This would result in the total impact on the grain farming sector being larger than just the value of the additional wheat produced.
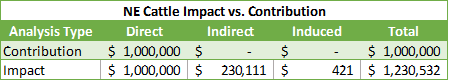
Table 1 provides an example of what this difference means in terms of results from IMPLAN. Shown are the results of running both a contribution and an impact analysis in the state of Nebraska of $1 million in sales in the “beef cattle ranching and farming” sector on itself. In the contribution analysis, the initial direct value results in no additional activity in that sector. In the impact analysis, however, the initial direct value of $1 million results in $230 thousand additional indirect sales in the cattle sector as well as a small amount of additional sales through induced effects.
Table 1. Single-industry Impact vs. Contribution Comparison
These differences can become even more significant when considering an analysis that includes multiple interconnected industries. In a multi-industry contribution analysis, all included industries are restricted from causing indirect and induced effects to each other. Table 2 shows the results of a contribution analysis of the full value of the “grain farming” and “beef cattle ranching and farming” sectors in Nebraska. In terms of sales (output), the initial (direct) value belonging to the two sectors of $17.67 billion has a total contribution effect of $28.33 billion.
[1] Indirect effects capture the business-to-business purchases down the supply chain. Induced effects capture the spending of household income throughout the local economy
Table 2. Cattle and Grain Contribution Summary
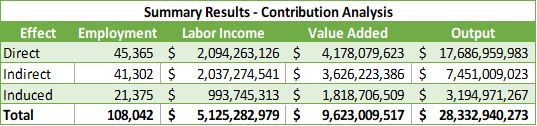
Table 3 shows the results of an impact analysis with the exact same inputs (sectors, values, geography, and model year) as the contribution analysis in Table 2. Even though the direct values are the same, the change in methodology results in much higher total values. In this example, changing the methodology from a contribution to an impact analysis results in 21,770 more jobs, $1.02 billion more in labor income, $1.92 billion more in value added, and $5.72 billion more in output.
Table 3. Cattle and Grain Impact Summary
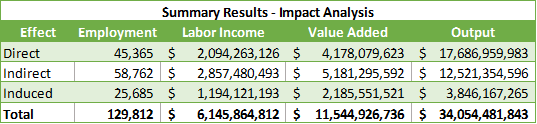
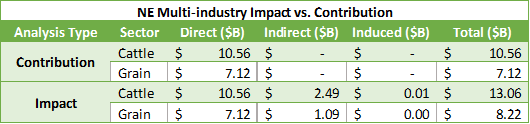
Table 4 shows the effects (in terms of output) of the “grain farming” and “cattle ranching and farming” sectors on themselves and each other for these two analyses, just as Table 1 did for the single-industry example. As shown, there are no indirect or induced effects between the two sectors in the contribution analysis, while there are almost $3.6 billion in indirect effects (and some minor induced effects) in the impact analysis. Note that this is less than the total difference in output between the two analyses; this initial difference of roughly $3.6 billion further ripples throughout all of the other sectors in IMPLAN to create the final difference of $5.72 billion in output.
Table 4. Multi-industry Impact vs. Contribution Comparison
Also note that, in the impact analysis, the additional indirect and induced effects cause the total value of the grain and cattle sectors to be larger than they are in reality. In other words, if an analyst is attempting to quantify the size of an existing industry and does so using an impact analysis, they would actually be overstating the true size of the industry. This is precisely why a contribution analysis includes the model constraints mentioned above, and why it is so important to use the appropriate type of analysis.