

2019 has been a very busy, productive year for the DIS team. From long-term additions to the team, an intense, short need from six interns and a bit of churn, we have had a great ¾ of 2019. At any one time, the DIS team could be working on 20-25 different projects – some big, some small, some short-term, some long-term. I often say that getting laid off in 2009, while difficult at the time, has turned out to be a rather enjoyable ride in the ten years since I’ve been working with the company. I get to do most all the things I used to enjoy and learn MANY new things working on exciting projects for other clients.
For example, when we were all working together at Iowa Farm Bureau (West Des Moines, IA) from 2005-2009, Sterling Liddell and Tim Johnson developed a “corn bidding” methodology (first of its kind to my knowledge) and used it to model the impact of a rapidly growing Iowa ethanol industry’s impact on the supply and use of Iowa corn and how that use of corn was affected by it being used for local (and distant) livestock and poultry.
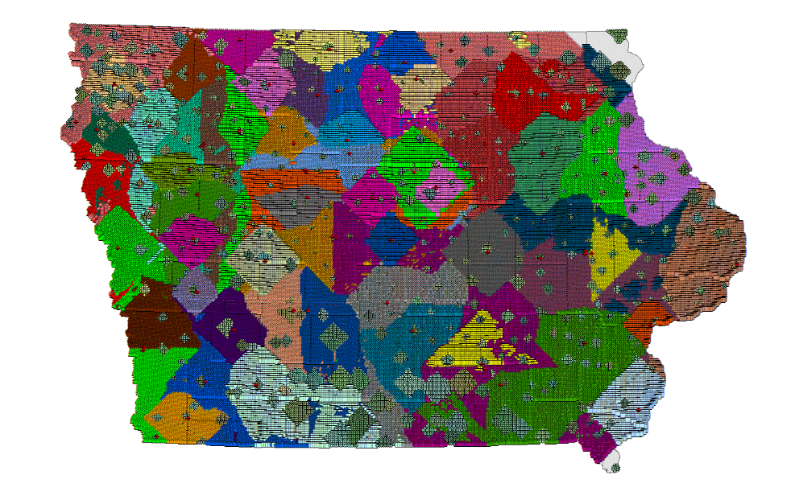
Having recently completed some schooling at the Royal Agricultural College in the UK, I was but a bystander at that time to the intuitive “quilt maps” made to demonstrate the impact of so many ethanol plants being built in Iowa. For example, back in 2006, the “quilt map” showed below would be the outcome if all in operation, under construction and announced ethanol plants were to come to fruition and source the corn needed to produce their “nameplate” capacities, many of which were 100 million-gallon-per-year plants. Of note, the map also accounted for livestock and poultry demand for corn (each color denotes a source of demand (including ethanol) and its associated draw area) and the fact that the model assumed it would “take precedence” over corn used for ethanol. As shown in the map below, there would have been very little corn available beyond what would be needed for livestock, poultry and renewable fuels.
Fast forward about thirteen years to this past summer when the DIS team was able to complete a substantial multi-client project for a few Missouri-based farm organizations using, in part, the original concept mentioned above. The goal of this research was to help them better understand the flow of four farm commodities (corn, soybeans, grain sorghum and wheat) within and without the State of Missouri. In order to do this work, the following was quantified and studied:
- Quantification of relevant farm commodity production and associated utilization for all Missouri counties and those in peripheral crop reporting districts
- Understanding of storage and grain stocks situation
- Off-farm storage of commodities
- On-farm storage of commodities
- Calculation of major demand sources, including livestock and poultry feed, renewable fuels, processing and exports for all study area counties/crop reporting districts
- Calculation of supply deficit and supply surplus counties
- Quantification of preferential and general demand points
- Conduct a Dynamic Flow Analysis® for relevant commodities to estimate movement of commodities from surplus supply points to demand points
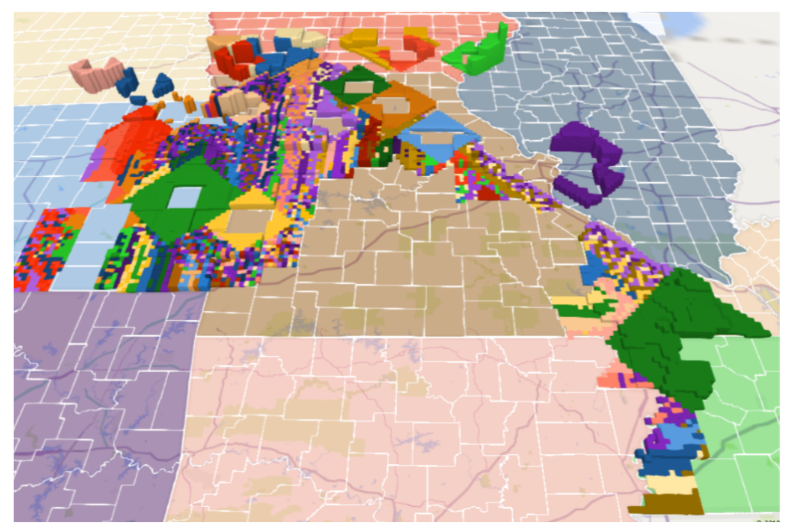
The results of the study released in July relied upon tens of thousands of lines of code, thousands of data points, dozens of intuitive maps and many ideas for further research. The still shot of an interactive map below, for example, shows the net effect of where corn is moving after 1) accounting for feed usage by livestock and poultry, 2) how big the corn “draw areas” are for preferential demand points (i.e., ethanol plants) and 3) where the rest of the corn is “claimed”. Another map was created to show from where remaining corn is exported, primarily by barge down the Mississippi River.
After starting with the work done in 2006, preparing the extensive input dataset, and then working through many iterations of code development, learning a new way to loop that code, we had many interesting findings, including:
- For major crops, production concentration is very pronounced throughout Missouri
- Because of their drawing power for exports (attractive basis), the Mississippi and, to a lesser extent, the Missouri rivers have a large impact on the flow of commodities into and throughout the state
- Counties which have large concentrations of livestock or renewable fuels plants are almost universally supply deficit, particularly for corn and grain sorghum
- There are significant levels of commodity storage, both on and off the farm, which has been increasing substantially in recent years
- Using Dynamic Flow Analysis® methodology, interesting flow patterns by crop by demand point were identified
- Shipments of farm and related commodities in and out of Missouri continues to be dominated by truck, but rail and barge also experience large volumes of shipments of farm and related commodities
- Commodity flows of Missouri produced commodities is complex and diverse. Commodities flow from farms though various channels to local elevators, directly to processors, to terminal elevators, to export facilities and to distant feed mills. Movement of commodities can be within a county, across counties, across many counties and can move from Missouri to other states and from other states into Missouri.
Our team at DIS is looking forward to using this new process to help other clients understand and make decisions regarding the infrastructure supporting the movement of commodities.