Yellow grease (YG) and choice white grease (CWG) are marginal value commodities. YG can be many products such as used cooking oil, lower quality fat from slaughter houses and rendering plants. CWG is mainly rendered porcine fat. Both YG and CWG are used to produce livestock and poultry feed as a fat source. They are also used in biodiesel production as feedstocks.
Supply
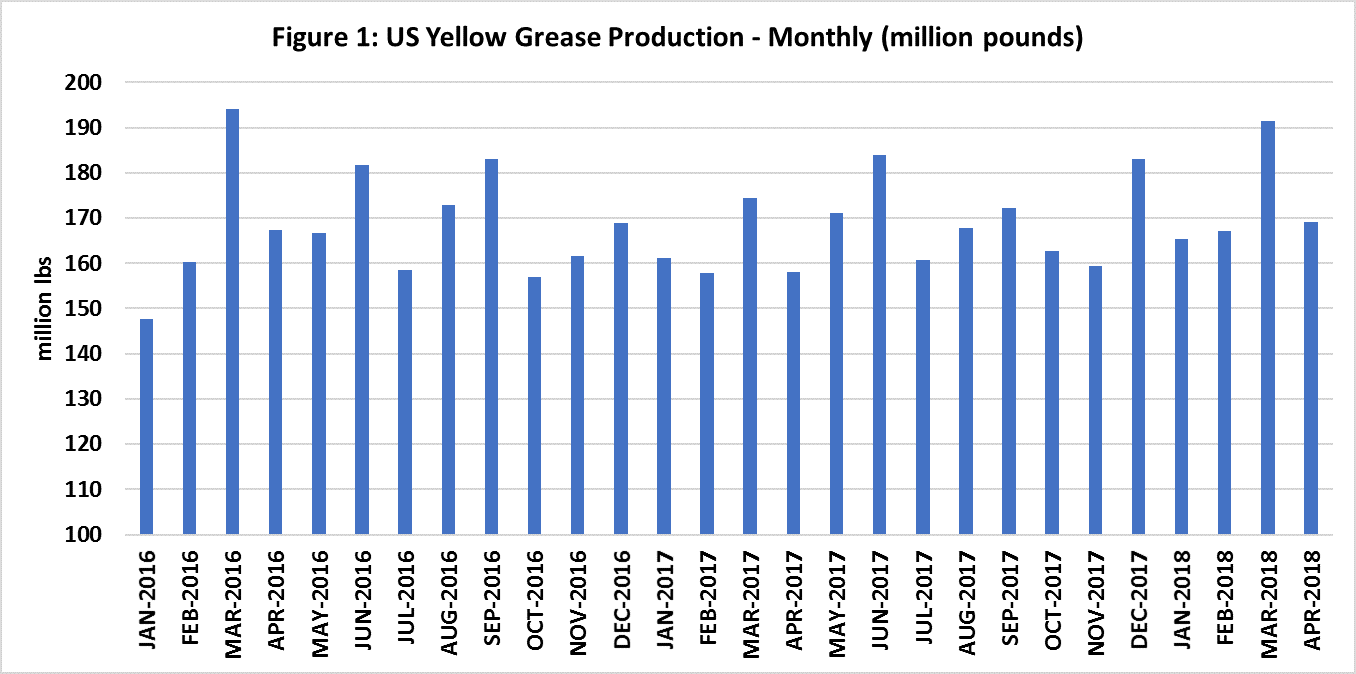
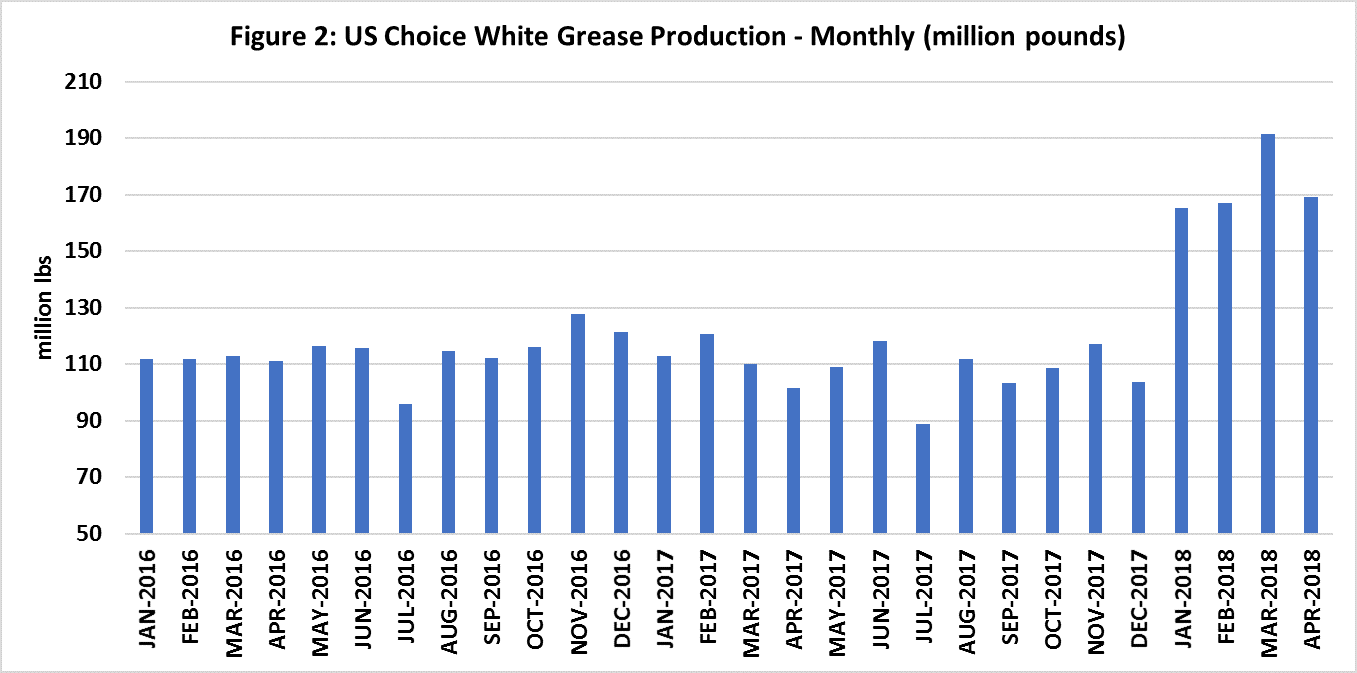
Figure 1 and Figure 2 show monthly YG and CWG production (million pounds) from January 2016 to April 2018. These data were collected from the United States Department of Agriculture – National Agricultural Statistics Service (USDA-NASS). The total YG production in 2017 was 2.01 billion pounds. The total production of CWG was approximately 1.3 billion pounds in 2017. YG production has not changed dramatically over the last few years. However, CWG production in the first four months (January-April) in 2018 has soared nearly 55 percent, compared to the same period in 2017. This is mainly due to significant increase in hog slaughter numbers in 2018.
Demand
U.S. consumption of inedible greases have increased in recent past mainly due to high demand from the biodiesel sector. Exact numbers of YG and CWG utilization in livestock and poultry feed are relatively unknown and a challenge to get approximate estimates.
In our June 2018 AgMRC Renewable Energy Report, we presented total YG and CWG utilization in U.S. biodiesel production. In 2017, 1.47 billion pounds of YG were utilized in biodiesel production, compared to 1.38 billion pounds in 2016. In 2017, 0.59 billion pounds of CWG were used in the biodiesel industry, compared to 0.57 billion pounds in 2016. Approximately 74 percent of the U.S. YG production and approximately 45 percent of the U.S. CWG production is consumed by the biodiesel sector
Prices
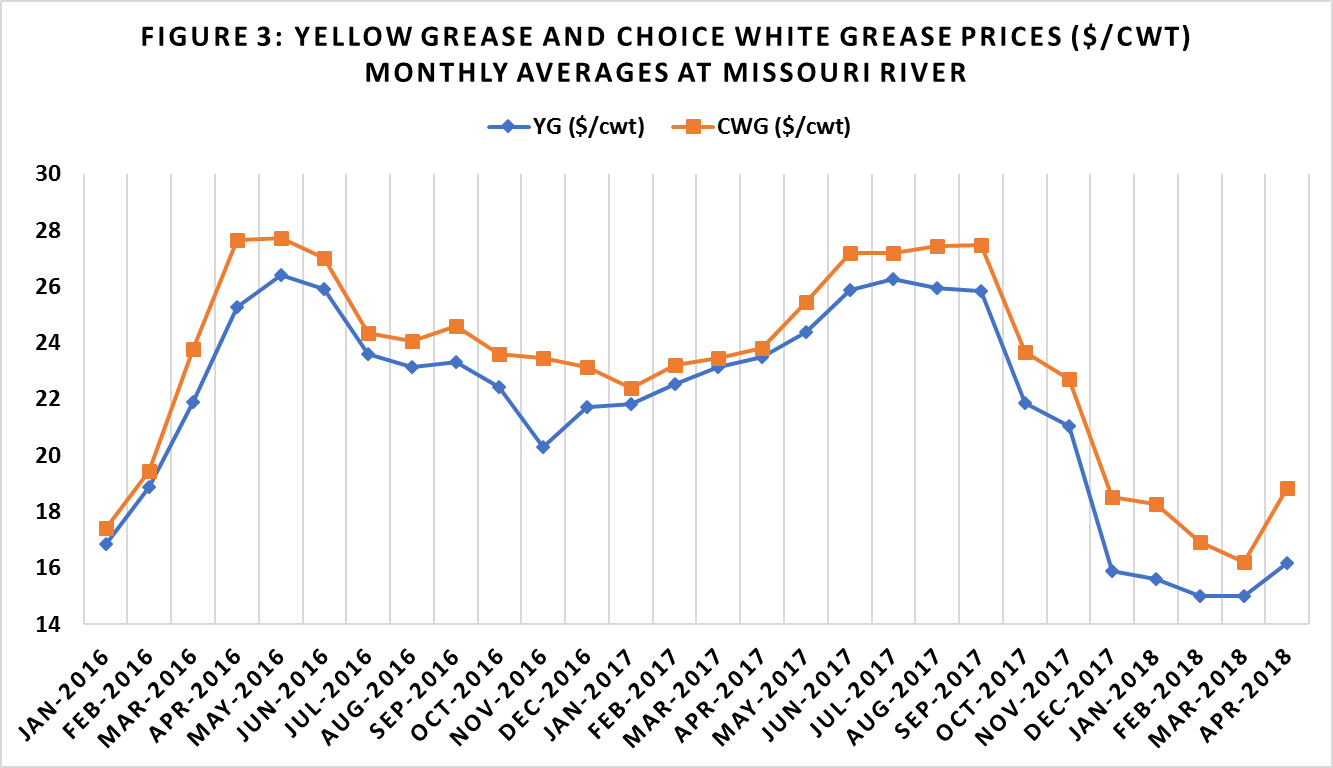
Figure 3 shows monthly average prices of YG and CWG at Missouri River location from January 2016 to April 2018 (Data source: Jacobsen). YG and CWG prices are highly corelated. The correlation coefficient between YG prices and CGW prices is 0.98. As seen in Figure 3, both YG and CWG prices show strong seasonality. Prices start to soar from January to May-June and then slip down during the Fall season.
Understanding YG and CWG price behaviors and their determinants presents some significant challenges in the feed and biodiesel market places. Our DIS team has done some significant analytical work on determinants of YG and CWG prices. Price discoveries of YG and CWG are not transparent in the market place. Therefore, we developed time series econometric models to estimate linkages between corn, soybean oil, and heating oil futures with YG and CWG prices over the last 18-year time period. Then we use the estimated parameters of empirical statistical models to forecast YG and CWG prices in the next 6 months period. Doing so, we have generated futures implied YG and CWG prices for our clients to make better business decisions and risk managements. More about models that we used can be found in our blog titled “Picking the Right Data Analysis Tool Yields Improved Risk Reduction” written by Jing Tang.