

Drought Conditions
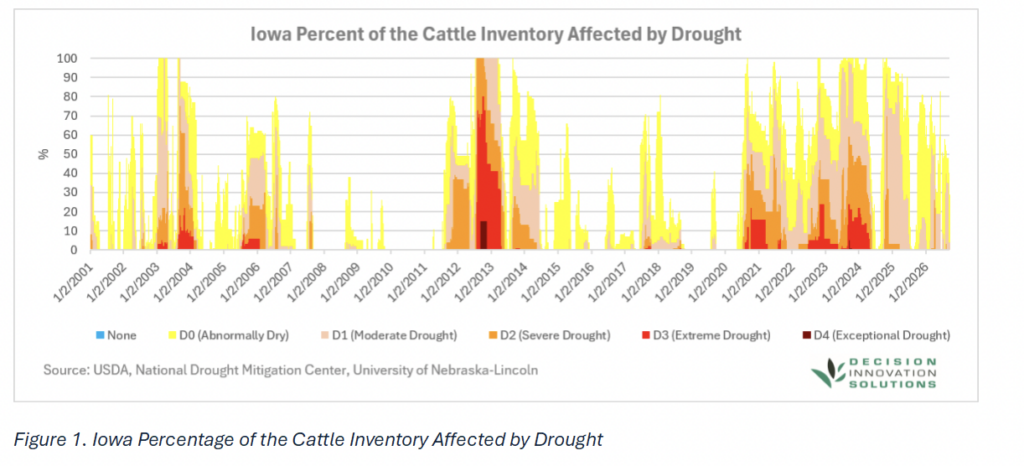
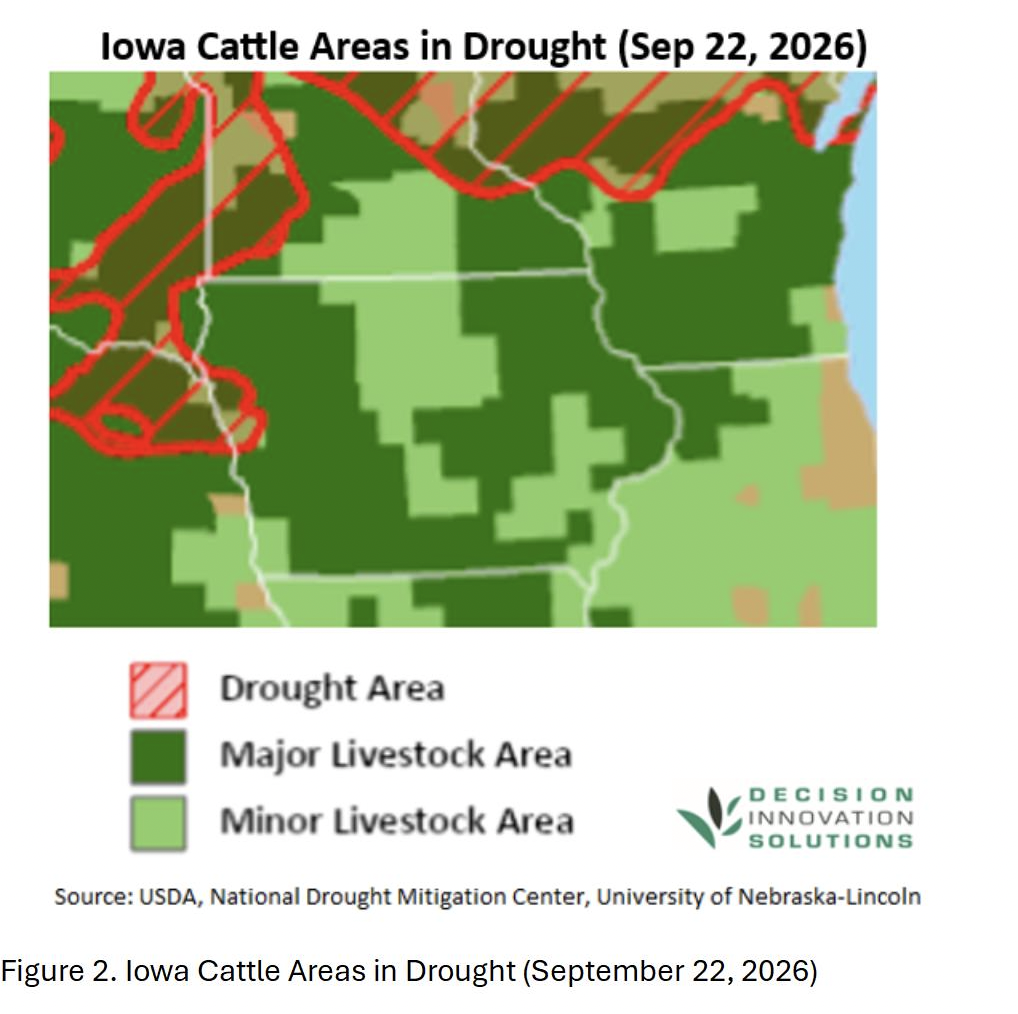
One factor influencing cattle inventory decisions is drought, which can reduce herd size through liquidation, delay rebuilding of the herd, and shift culling and slaughter patterns. Over the past couple of years, much of Iowa’s cattle inventory has been exposed to abnormally dry conditions, with periods of moderate and extreme drought also affecting the state (Figure 1). In 2024, an average of 66% of the cattle were under abnormally dry conditions in some parts of the state. In some regions, moderate drought affected 42% of the cattle inventory, while severe and extreme drought affected 18% and 4%, respectively. In 2025, drought conditions improved compared with the previous year. During this period, abnormally dry conditions affected 62% of the cattle inventory in some areas, while the share exposed to moderate drought declined to 28%. Severe drought affected only 1% of the cattle inventory in some regions. From January through September 22, 2026, an average of 53% of cattle inventory has been under abnormally dry conditions in some regions, moderate drought impacted 25% of the cattle inventory, while severe drought affected 2%. Note that these are annual/quarterly averages, but conditions varied widely across specific periods and dates during the year. For example, on September 22, 2026, abnormally dry conditions affected an average of 5% of Iowa’s cattle inventory in some areas, while moderate drought affected only 2% in some regions. Figure 2 shows Iowa cattle areas in drought conditions on September 22, 2026.
Inventory Distribution and Value
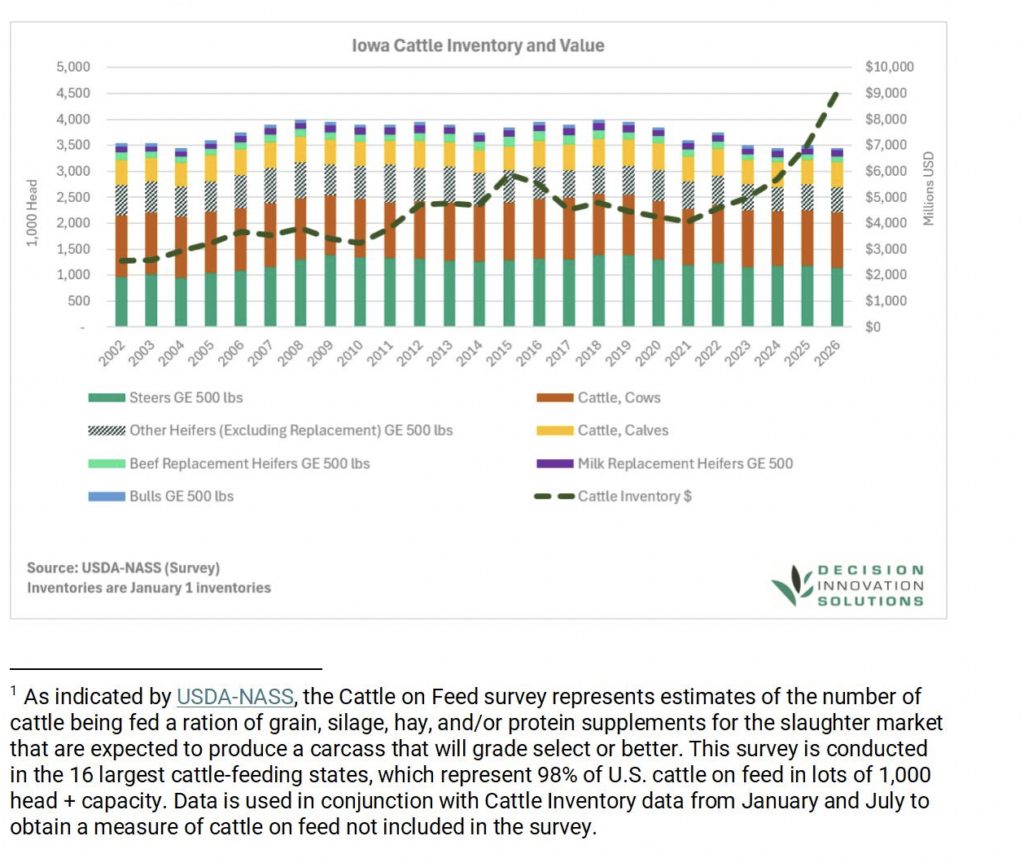
Iowa’s cattle inventory, including calves, has fluctuated over the last 25 years based on USDA January Survey data, ranging between 3.45 million and 4.00 million head. On January 1, 2026, inventory was estimated at 3.45 million head, down 1.4% from the previous year and 13.8%, or 550,000 head, below the record high in 2008 and 2018 (Figure 9). Steers greater than or equal to 500 lbs. accounted for about 1.14 million head, or 33.0% of total inventory. Cows accounted for about 1.06 million head, or 30.7% of total inventory, including 815,000 beef cows and 245,000 milk cows (Figure 2).
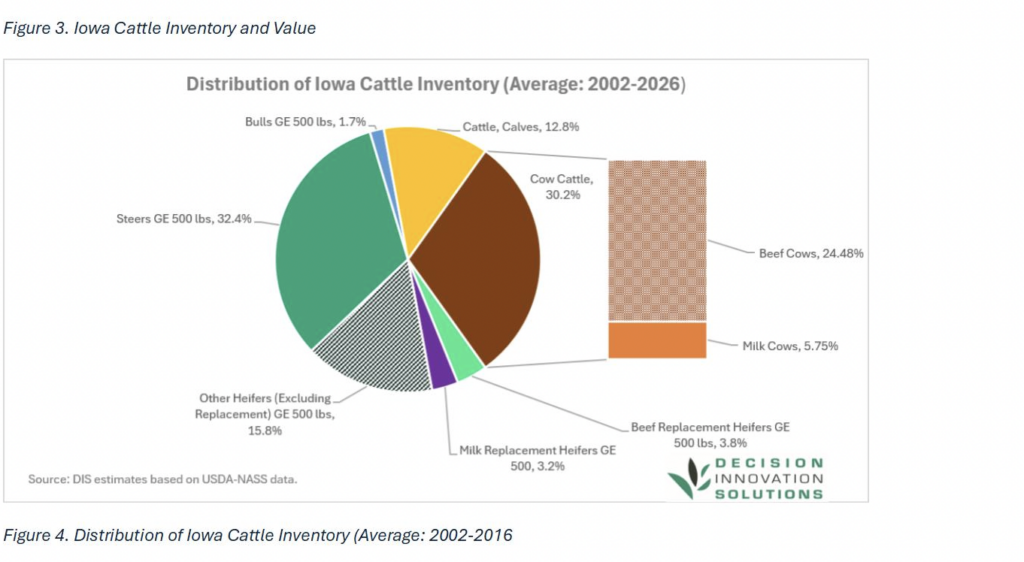
Although Iowa’s total inventory has varied, the shares of the different cattle categories have remained relatively stable during the last 25 years. On average, steers greater than or equal to 500 lbs. represent 32.4% of the total inventory, while cows account for about 30.2%. Within the cow inventory, beef cows make up 80.9%, or about 24.5% of total inventory, while milk cows account for 19.1% of the cow inventory, or about 5.8% of total inventory (see Figure 4). Other heifers greater than or equal to 500 lbs., excluding replacements, account for about 15.8% of inventory. Calves account for 12.8%. The remaining components are beef replacement heifers greater than or equal to 500 lbs., milk replacement heifers greater than or equal to 500 lbs., and bulls greater than or equal to 500 lbs., which make up 3.8%, 3.2%, and 1.7% of total inventory, respectively, on average.
The state cattle on feed (COF)1 inventory was about 1.18 million head in 2026, down 2% from 2025.
The value of Iowa cattle inventory peaked in 2026 at $9.04 billion, up 29% year-over-year. On a per-head basis, the value of Iowa’s cattle inventory increased 31%, from $2,000 per head in 2025 to $2,620 per head in 2026.
Iowa cattle production increased 3.1% to 2.14 billion pounds in 2026 year-over-year, the fifth-highest level since 2002. The value of cattle production also reached a record high of $4.98 billion, up 22% year-over- year, supported by record-high prices.
Cash Receipts
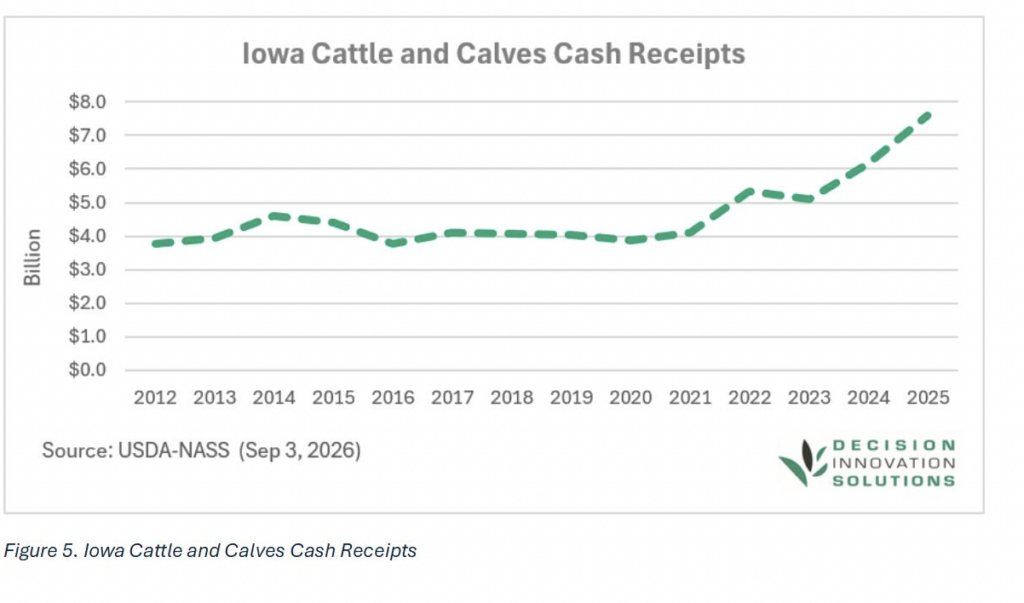
Iowa cash receipts from cattle and calves rose 23.5% to $7.60 billion in 2025, accounting for 19.0% of Iowa’s agricultural cash receipts of $39.96 billion (Figure 5). Iowa ranked fourth among states in cattle cash receipts, after Nebraska, Kansas, and Texas. Iowa generated 5.7% of U.S. cash receipts from cattle and calves, which totaled $133.67 billion in 2025.
This report highlights drought as an important factor in cattle inventory decisions because it limits pasture and forage availability. Other relevant factors include feed availability and prices, production costs, and cattle and beef market prices and demand. Long-term biological cycles also affect inventory size.
According to USDA-NASS data, Iowa’s cattle and calves inventory totaled 3.45 million head on January 1, 2026—550,000 head below the 2018 record high. Over the past five years, Iowa’s cattle and calf inventory averaged 4.0% of the U.S. total.
The U.S. cattle and calf inventory declined 6.1%, from 91.79 million head in 2022 to 86.16 million head in 2026, while Iowa’s inventory fell 8.0% over the same period.
In 2025, Iowa accounted for 5.7% of national cattle and calves cash receipts, while cattle and calves represented 19% of the state’s total agricultural cash receipts.
Recently, the Iowa Cattlemen’s Association (ICA) announced the Building Iowa’s Cattle Future policy package2, which identifies five state-level priorities aimed at strengthening Iowa’s role in rebuilding the U.S. cattle herd and enhancing the economic vitality of its rural communities. The priorities are to: 1) support young and beginning farmers; 2) expand the state’s meat-processing capacity; 3) increase the Working Lands Program; 4) keep productive farmland in agriculture for future farmers; and 5) integrate cattle into land management to improve water quality.