

The gross production margin (GPM), in the ethanol industry, commonly represents the difference between the combined sales values of ethanol, distiller’s dried grains (DDGS) and distillers corn oil (DCO), and the price of corn and is expressed in terms of dollars per bushel. All data came from National Weekly Grain Co-Products Report from the USDA AMS website. The latest data was updated on June 8th, 2026 (the blog was written June 9th, 2026). GPM calculation shows the calculated relationship between values of ethanol and ethanol co-products and the cost of corn in ethanol production.
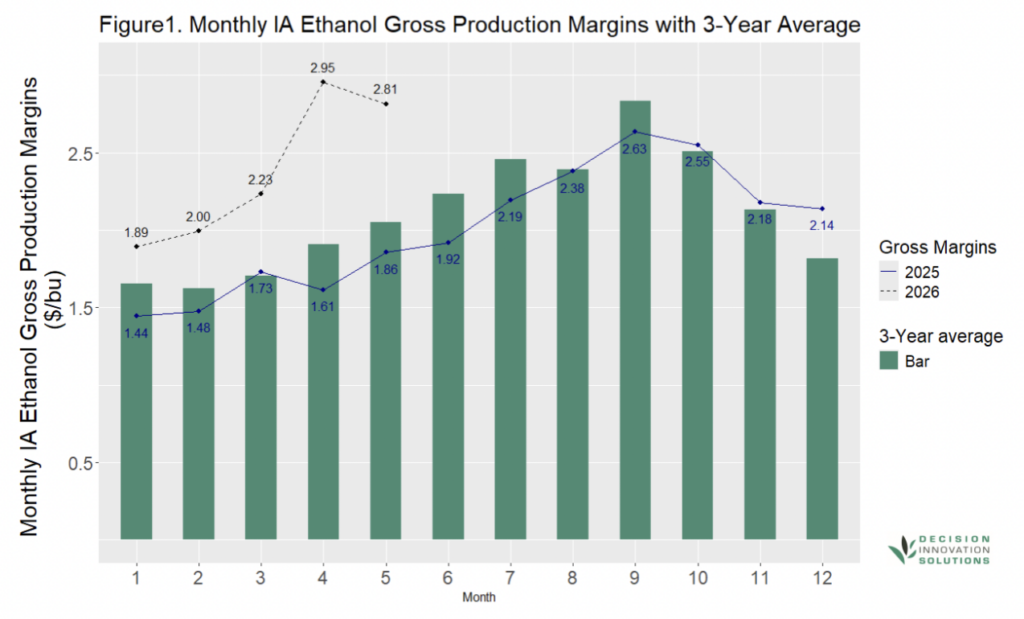
Figure 1 shows the monthly average Iowa ethanol GPM of the year 2025 and 2026, by a solid line and dashed line, respectively. Figure 1 also shows the three-year average (2023 to 2025) of Iowa ethanol GPM for each month. Almost all summary monthly GPMs in 2025 were below or close to the three-year average values, while, after October 2025 and all the studied months in 2026, the GPMs have been above the three-year average values.
Within the time frame of the study, average corn prices were $4.125/bu in 2025 and so far in 2026 have averaged $4.121/bu, which were lower than the corresponding prices in 2023 and 2024, which were $5.73/bu and $4.16/bu, respectively. Corn prices remained about the same, compared to the 2024 price, but decreased about 28% from 2023 to 2026.
Calculated GPMs vacillated up and down since 2024. The GPM reached relatively low values in the first half year in 2024, with an average GPM of $1.67/bu, which is about 43% lower than the first 5-month-average GPM in 2026, ($2.38/bu). The GPM then rose slightly to $1.96/bu in the second half of 2024, but dropped back to $1.67/bu in the first half of 2025, and then back up to $2.28/bu in the second half of 2025.
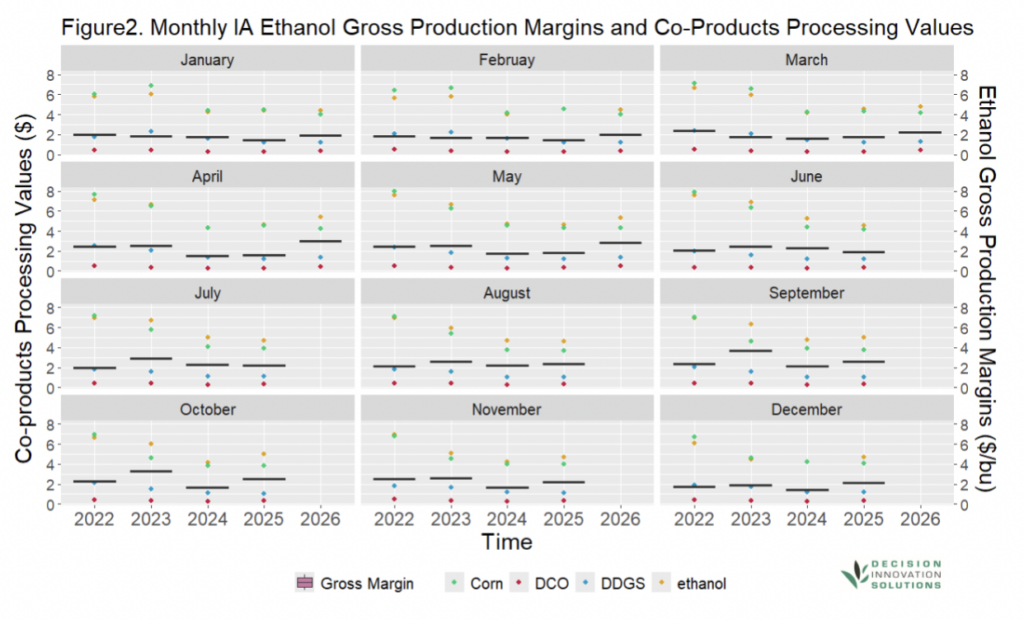
Average DCO values were $0.32/bu and $0.42/bu for 2025 and the first five months of 2026, respectively, reflecting increases of about 23.0% and 60.0%, compared to the average DCO value ($0.26/bu) during 2024. Ethanol values increased about 4.4% and 8.5% during the same period, and DDGS values decreased about 9.4% and increased 1.7% during the same period.
In Figure 2, the scatter points represent the sales values (raw data from AMS weekly report) for corn, ethanol, DDGS, and DCO using green, yellow, blue, and red color, respectively. The boxplots in pink represent the range of weekly IA ethanol GPMs.
Applying ANOVA and the Tukey-HSD test1 on the study period, i.e., January 2023 to May 2026, we found that:
· For the first quarter of year, in general (combined January to March monthly GPM values), the GPM value in 2026 is significantly higher than 2024 and 2025; and there is no significant difference among the GPM values in the other years.
· For the second quarter of year, in general (combined April to June monthly GPM values), the GPM value in 2026 is significantly higher than 2024 and 2025; the GPM value in 2023 is significantly higher than 2024 and 2025; and there is no significant difference among the GPM values in other years.
· For the third quarter of year, in general (combined July to September monthly GPM values), the GPM value in 2023 is significantly higher than 2024; there is no significant difference among all other years in the studied period.
· For the fourth quarter of year, in general (combined October to December monthly GPM values), the GPM value in 2023 is significantly higher than 2024; and there is no significant difference among the GPM values in other years.
Applying the Pearson correlation test, we found that within the study period, corn price has had a significant and negative effect on GPM in all the summer months. The sales value of DDGs has had significant and positive effects on GPM from May to November. The sales value of DCO has had a significant and positive effect on GPM in most months except June, in which it had a negative, but not significant, effect. The sales value of ethanol has had a significant positive effect on GPMs from April to December. In summary, the ethanol price (ethanol sales value) is still the dominant variable throughout the study period. It has had the strongest significant positive effect on GPM values, especially in the second half of each of the years studied.