

The U.S. poultry industry has experienced significant changes in recent years, but those changes have not been uniform across chicken, turkey, and eggs. Differences in prices, consumer demand, and production reveal three distinct market trends within the broader poultry industry.
Price
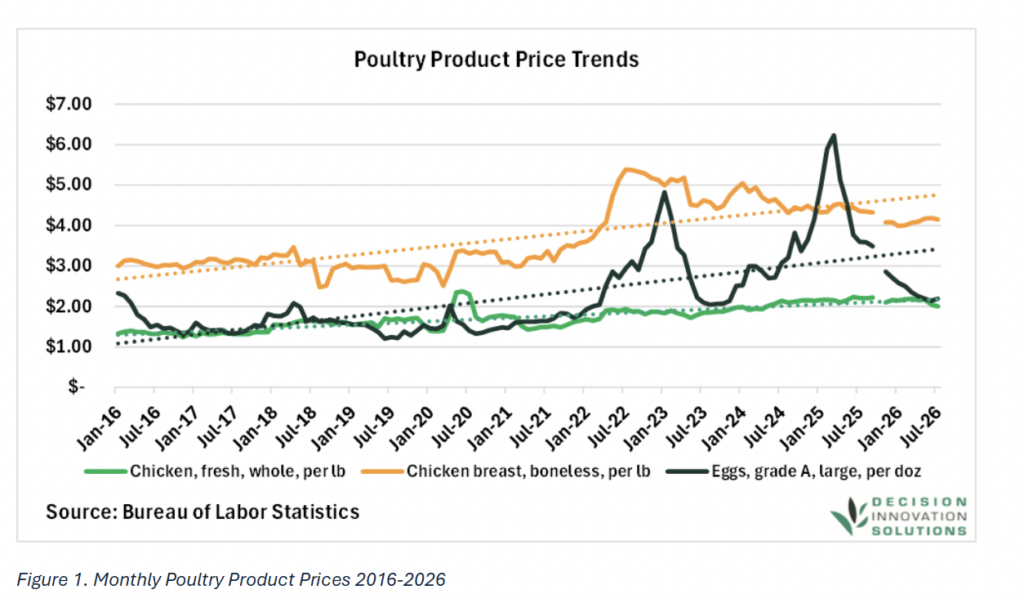
In recent years, poultry prices have responded differently across products, reflecting changes in supply, consumer demand, and industry conditions. Whole chicken prices have remained relatively elevated, rising from $1.84 per pound in January 2023 to $2.01 per pound in July 2026, a 9.2% increase. In contrast, boneless chicken breast prices have moved lower, declining 16.8% from $4.99 per pound in January 2023 to $4.15 per pound in July 2026. The divergence between these two products highlights that price movements within the chicken market have not been uniform.
Egg prices have experienced the most pronounced volatility. Grade A large eggs increased from $4.82 per dozen in January 2023 to a record $6.23 per dozen in March 2025 before falling sharply as egg supplies recovered. By July 2026, egg prices had declined to $2.19 per dozen, roughly 65% below the March 2025 peak and at less than half their January 2023 level. The magnitude of this decline contrasts sharply with the more modest changes observed in chicken prices and reflects the particularly severe supply disruptions experienced in the egg industry during the HPAI outbreaks. Overall, the price trends illustrate how different segments of the poultry industry have responded to changing supply conditions, with egg prices undergoing a much more pronounced adjustment than chicken prices (Figure 1).
Demand
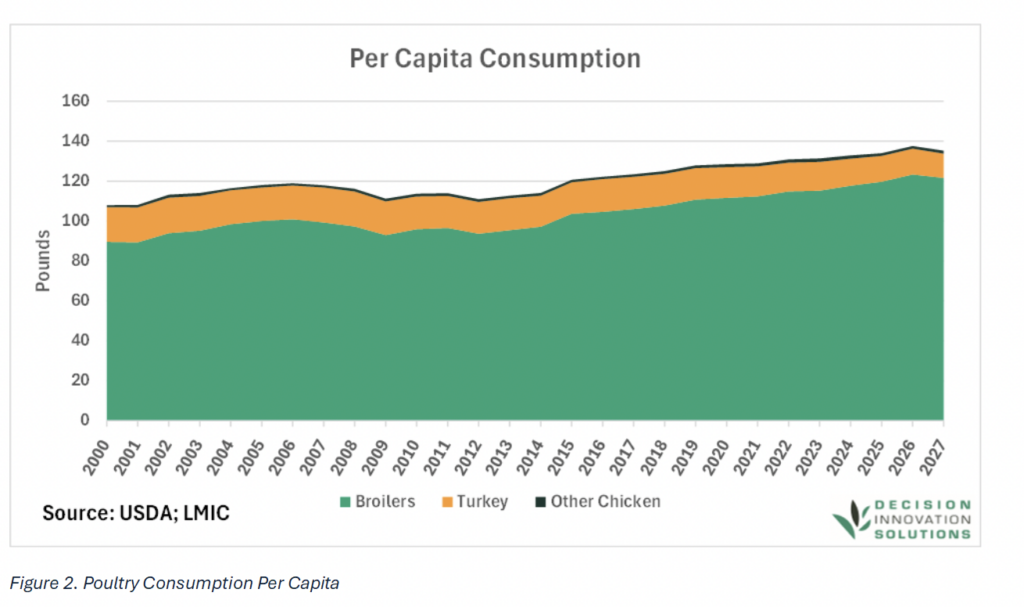
The most significant long-term trend in U.S. poultry demand has been the continued growth in chicken consumption. From 2016 to 2026, per-capita broiler consumption increased from 104.6 pounds to 123.3 pounds, an increase of 17.9%. Growth was relatively consistent throughout the period, with broiler consumption increasing nearly every year. By comparison, turkey consumption moved in the opposite direction, declining from 16.4 pounds per person in 2016 to 12.9 pounds in 2026, a decrease of 21.3%. Other chicken, comprised of mainly spent layers and mature roosters processed for meat, consumption remained relatively small and stable, ranging between 1.2 and 1.7 pounds per person over the period (Figure 2).
The divergence between chicken and turkey consumption has become increasingly pronounced. In 2016, per-capita broiler consumption exceeded turkey consumption by 88.2 pounds. In 2026, that gap has widened to 110.4 pounds. The continued growth in chicken consumption alongside declining turkey consumption indicates a shift in the composition of U.S. poultry demand. These differences in consumption provide demand side context for the production trends observed across the poultry industry.
Supply
Production trends further highlight the differences across the major segments of the U.S. poultry industry. Since 2016, broiler production has generally increased, while turkey production has declined and egg production has fluctuated more substantially (Figure 3).
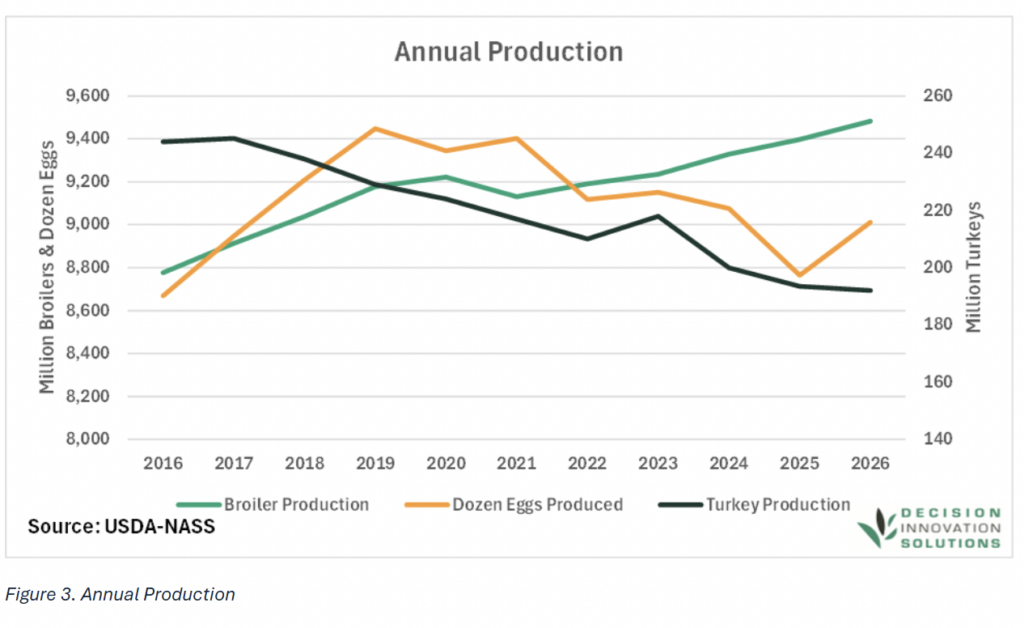
Broiler production has shown the most consistent growth over the period. Annual broiler production increased from 8.78 billion head in 2016 to a projected 9.48 billion head in 2026, an increase of approximately 8%. While production declined slightly in 2021, it has increased in each subsequent year, reaching a projected high of 9.48 billion head in 2026. This relatively steady expansion is consistent with the continued growth in per-capita chicken consumption observed over the same period.
Turkey production has moved in the opposite direction. Annual turkey production declined from 244 million head in 2016 to 194 million head in 2025, a decrease of roughly 21%. The 2026 projection of 192 million head would represent a further decline, leaving production approximately 21% below 2016 levels. The contraction in turkey production corresponds with the continued decline in per-capita turkey consumption, which has fallen substantially over the same period.
Egg production has followed a more volatile path. Production increased from 8.67 billion dozen in 2016 to 9.45 billion dozen in 2019 before declining following HPAI-related disruptions to the egg-laying flock. Production remained below its pre-HPAI peak through 2025, when approximately 8.77 billion dozen eggs were produced. However, 2026 production is projected to rebound to approximately 9.01 billion dozen, an increase of 2.8% from 2025. The recovery in production also coincides with the sharp correction in egg prices observed since 2025, suggesting that the rebuilding of egg supplies has eased some of the supply pressure that contributed to elevated prices.
The U.S. poultry industry is increasingly characterized by divergent market conditions rather than a single industry-wide trend. Chicken consumption and production have continued to expand, while turkey consumption and production have contracted. Egg production, meanwhile, has been more heavily influenced by HPAI-related supply disruptions and is now recovering alongside a substantial decline in prices. Together, these trends demonstrate the importance of examining individual poultry segments when evaluating market conditions and their potential economic impacts.