

Farmers and ranchers are experts in their fields. They know what they are producing, what it costs, and what it is worth when it leaves their hands. But what happens after it leaves the farm? A commodity may pass through additional markets, processors, and businesses before reaching the end user.
So where does it go? Where are the businesses and industries that demand it? Where is it processed or consumed? And how much of what a region produces moves elsewhere? Production data alone cannot answer all of these questions.
Connecting the Pieces
Agriculture generates no shortage of data. Public sources provide information on production, livestock inventories, commodity prices, processing capacity, trade, and many other aspects of the agricultural economy. Each provides insight into a different part of the market.
The challenge is connecting these pieces. Production data can show how much of a commodity is produced, while processing and market data can show where demand exists and which businesses use those commodities. Bringing these sources together can help answer questions that individual datasets cannot, such as:
· How much of what a region produces is used locally?
· How much of it moves out, and where does it go?
· If local processors aren’t using local supply, where does the supply originate?
What the Connections Reveal
Consider a state that produces millions of bushels of a particular commodity and has several processors operating within its borders. It may be tempting to assume those processors are using the state’s production, but that is not necessarily the case. Just because a commodity is produced in an area does not mean it is processed there, and having a processor nearby does not mean it is using local production. Some local production may supply processors in other regions, while local processors may source their supply elsewhere.
Looking at both sides of the market can reveal whether local production is meeting local demand or not and indicate where it’s coming from. For producers and the organizations that serve them, understanding these relationships provides a clearer picture of where commodities go, which markets
depend on them, and where demand is concentrated. Looking across a state or region can also reveal how these relationships differ and identify areas that warrant a closer look.
Those relationships can also change over time. A market that has historically been important may grow, decline, or shift to another region. Changes in production, processing, or demand can alter where commodities move and who supplies them. Understanding these shifts can provide insight into how agricultural markets are evolving and where further research may be warranted.
However, simply having more information does not answer every question. Information cannot determine whether a particular opportunity is viable or what decision an organization should make. It can, however, show where the pieces fit together and help identify the questions worth asking next.
What This Can Look Like: Following Iowa Corn Beyond the Farm
To see how these market connections function in practice, consider Iowa. The state has averaged growing roughly 2.6 billion bushels of corn annually in recent years, with about 85% consumed locally by ethanol plants, livestock operations, and processors.
While 85% stays local, what happens to the remaining 15%? In a single year, our team estimated that more than 390 million bushels of Iowa corn moved out of state, reaching over 125 counties across 25 different states.
Destination markets like Louisiana and Texas received nearly 200 million bushels—likely supplying Gulf export channels and southern plains cattle feeding operations. Other key destinations included California, Nebraska, Minnesota, and Idaho. The map below illustrates how far Iowa corn travels beyond the state’s borders.
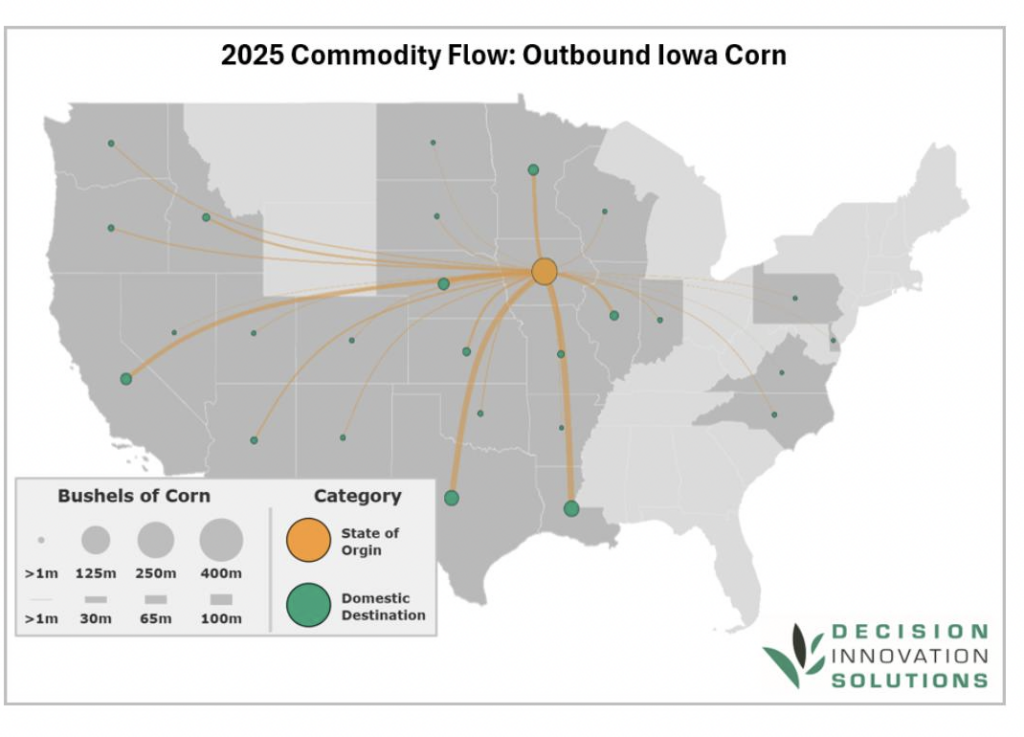
When supply and demand are mapped at the county level, patterns emerge that state totals hide, such as which specific regional feedlots or processing hubs draw Iowa corn and where Iowa processors turn when local supply is tight.
Applying this same framework across agricultural sectors nationwide reveals how individual commodities connect to broader markets:
· Crops:
o Estimating raw grain movement across Corn, Soybeans, Wheat, and Sorghum.
· Livestock: o Mapping production and transit channels for Cattle, Hogs, Sheep, Goats, and Poultry.
· Feed & Processing:
o Modeling co-products and inputs like Ethanol, Corn DDGs, Soybean Meal (SBM), Wheat Mids, Livestock Feed, and Bone Meal.
· Dairy:
o Projecting fluid Milk movement to regional demand centers.
Simulating these multi-commodity flows reveals where demand centers are likely concentrating, how regional markets interact, and where hidden value in the supply chain lies.
Looking Beyond the Farm Gate Farmers and ranchers are already experts in what they do. They know what they produce, what it costs, and what it is worth when it leaves the farm. Seeing where commodities travel after getting the check simply adds another facet to that expertise. What could you learn by following your region’s commodities beyond the farm gate?