posted by David Miller on Monday, August 7, 2023
Brazil and the U.S. are two of the largest suppliers of corn, soybeans, and meat to China. In recent years, the value of soybeans imported by China has increased to more than $61 billion per year. Corn and meat imports by China have leveled out in recent years with meat imports holding above $30 billion since 2020 and corn imports by China running between $7 billion and $8 billion per year. In 2022, Brazil and the U.S. accounted for more than 90% of China’s soybean imports; about 74% of China’s corn imports, and 46% of China’s meat imports (Figure 1).
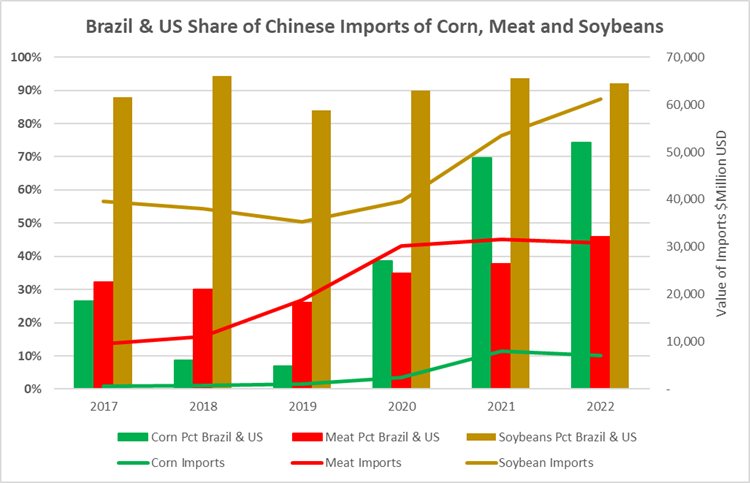
Figure 1. Brazil & US Share of Chinese Imports of Corn, Meat, and Soybeans
In the first half of 2023, China imported a total of $83 billion of agricultural imports. Brazil accounted for 37.1% of those imports for total agricultural sales to China of nearly $31 billion. Brazil’s share of China’s imports increased from 35.5% market share to 37.1% market share according to data from the Brazilian Ministry of Agriculture and Livestock (Mapa). This was an increase of 8.6% compared to the same period in 2022. To put Brazil’s exports to China in perspective, the $30.7 billion of exports to China in the first half of 2023 is greater than the total agricultural exports of Brazil to the other fifteen largest importers of Brazilian agricultural products combined, which this year totaled just over US$ 28.7 billion.
After the Asian country, the main markets for Brazilian agricultural products were: United States (US$ 4.7 billion); Netherlands (US$ 2.7 billion); Argentina (US$ 2.4 billion); Thailand ($1.9 billion); Japan ($1.9 billion); Spain (US$ 1.9 billion); Mexico (US$ 1.6 billion); South Korea (US$ 1.6 billion); Saudi Arabia (US$ 1.5 billion); and Indonesia (US$ 1.5 billion).
Soybeans and soybean products are responsible for 46% of the total volume Brazil exported to the Chinese market and contributed the most to the expansion of sales to China. But the increased reliance on China by Brazilian soybean farmers is setting off alarms to those who worry about single country dominance in their marketing chain. So far in 2023. 69% of all Brazilian soybeans were sent to China accounting for more than $23 billion in export sales. Other major importers of Brazilian soybeans were: the European Union (US$ 2.2 billion and a decrease of -30.1% compared to 2022); Argentina (US$1.6 billion and a strong increase of +1,156.4%); Thailand ($897 million); and Türkey (US$788 million).
An interesting piece of information: the main importer of Brazilian soybeans, China does not appear in the ranking of the largest buyers of soy meal and soy oil. With total sales of US$ 5.8 billion, soybean meal, which together with the oil have a higher added value than the oilseed without any processing, had as main destinations the European Union (US$ 2.7 billion); Thailand ($944 million); Indonesia ($836 million); Vietnam ($331 million); and South Korea ($284 million). Sales of raw soybeans to China does not allow for value-added activities on soybeans in Brazil.
Head-to-Head with Brazil Over the Chinese Market
For corn, the U.S. is well ahead of Brazil when it comes to exports to China. Figure 2 shows the split between Brazil and the U.S. on their corn sales to China. Of the combined value of corn exports shipped by Brazil and the U.S. to China, the U.S. holds a dominant position with 100% of the split in some years and more than 70% of the share between the two in 2022. As noted in Figure 1, Brazil and the U.S. accounted for 74% of the corn China imported in 2022 and the U.S. had more than 70% of those shipments.
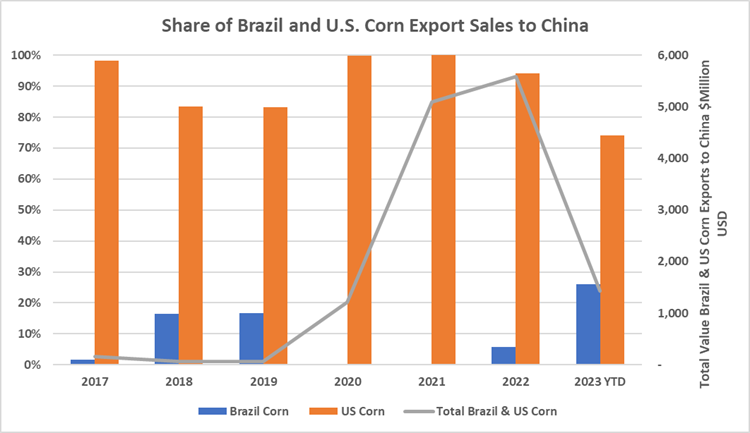
Figure 2.Share of Brazil & U.S. Corn Export Sales to China
For soybeans the picture is a bit different. As noted in Figure 1, Brazil and the U.S. account for more than 90% of soybean shipments to China, and in 2022 Brazil accounted for 64% market share between the U.S. and Brazil. This was the 6th year in a row since 2017 that Brazil has had at least 60% of the share of soybean sales to China between the U.S. and Brazil. In the first half of 2023, Brazil’s share of the U.S. and Brazilian sales of soybeans to China has risen to 77% (Figure 3). That percentage typically is higher in the first half of the year reflecting Brazil’s primary soybean shipping season. But reports this year are indicating that Brazil is still booking soybean shipments to China for September, October and November which traditionally have been weaker periods for Brazilian shipments and a stronger period for shipments of soybeans from the U.S. to China.
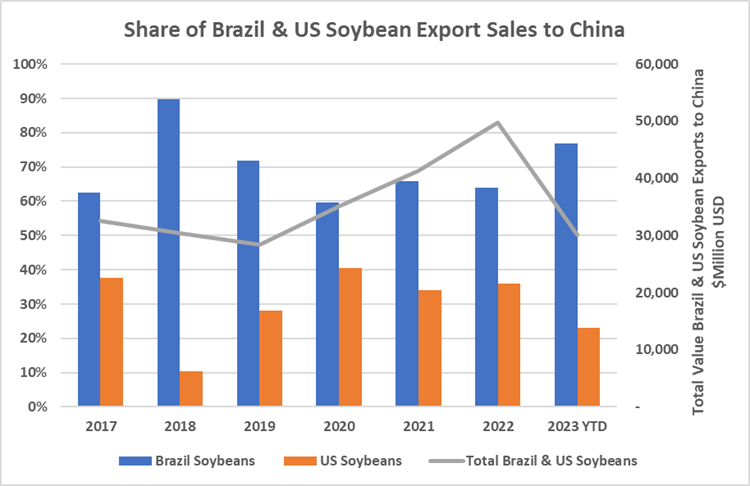
Figure 3. Share of Brazil and U.S. Soybean Export Sales to China
Shipment of meats to China from Brazil and the U.S. have increased in recent years with more than $31 billion in combined meat sales to China in 2022. And Brazil holds a significant lead on the U.S. with regards to the value of meats sent to China. In 2022, 71% of the meat shipped to China from Brazil and the U.S. originated from Brazil. Yes, the total value of meat exports to China from the two countries is increasing, but Brazil is capturing a larger share of those exports and has increased their share to more than 70% of the meat being shipped from Brazil and the U.S. to China.

Figure 4. Share of Brazil & U.S. Meat Export Sales to China
Competition in World Markets
When it comes to markets around the world, the U.S. has a clear lead over Brazil with more than 60% of the total Brazil and U.S. corn exports originating from the U.S. (Figure 5). In 2022, the value of combined Brazilian and U.S. corn exports topped $31 billion with the U.S. corn export shipments valued at more than $19 billion.
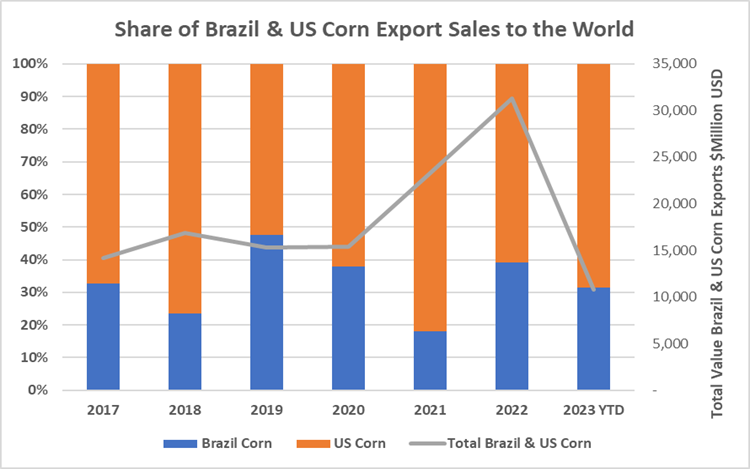
Figure 5 Share of Brazil & U.S. Corn Export Sales to the World
For soybean shipments to the world, the U.S. and Brazil accounted for $81 billion worth of sales, with Brazil’s sales topping $46.6 billion and U.S. soybean sales at $34.5 billion.
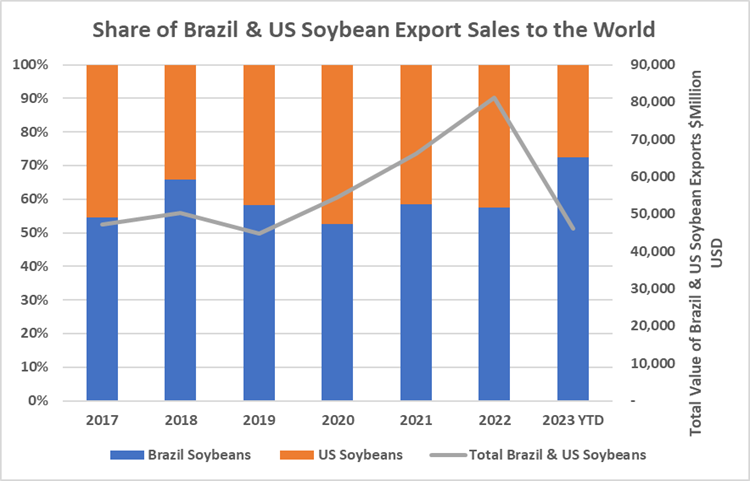
Figure 6 Share of Brazil & U.S. Soybean Export Sales to the World
With regards to meat sales to the world, the value is increasing in recent years with total meat sales to the world by Brazil and the U.S. topping $47 billion in 2022. Brazil accounted for 51% of the total U.S. and Brazil meat sales to the world in 2022 and for the first half of 2033 has accounted for 55% of the sales value. (Figure 7)
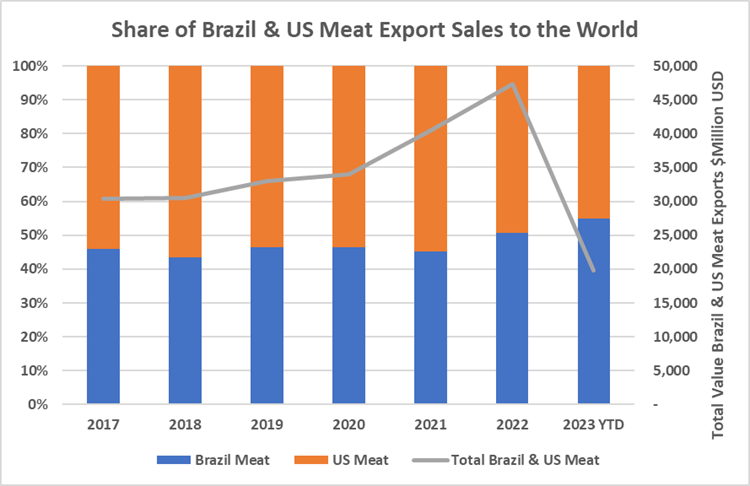
Figure 7. Share of Brazil & U.S. Meat Export Sales to the World
With regards to export sales, Brazil has the edge over the U.S. for soybeans and meats but the U.S. is still the leader for corn export value.