posted by S. Patricia Batres-Marquez on Thursday, April 20, 2017
Supported by economic growth, increasing household income, constrained farmland area, and a diversified diet that includes more animal protein, dairy products, and other consumer oriented products, China agricultural imports expanded since the beginning of the last decade.
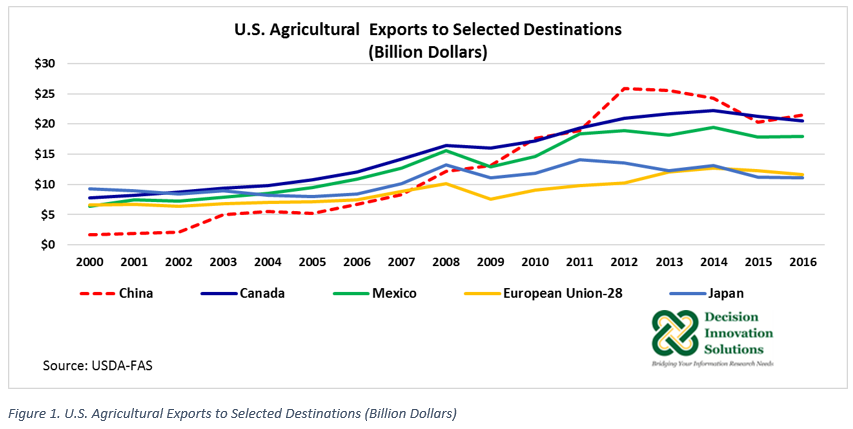
U.S. exports of agricultural products to China were up 5.7% to $21.4 billion in 2016 compared with the previous year. The value of agricultural exports to China was up from the value of agricultural exports to Canada ($20.5 billion) and Mexico ($17.9 billion) (see Figure 1), making China the top value market for U.S. agricultural products in 2016. Overall, the value of 2016 U.S. agricultural exports to China was 15.8% of 2016 U.S. total agricultural exports. The value of agricultural exports to Canada, Mexico, the European Union (EU), and Japan represented 15.1%, 13.2%, 8.6%, and 8.2%, respectively, of U.S. total agricultural exports in 2016.
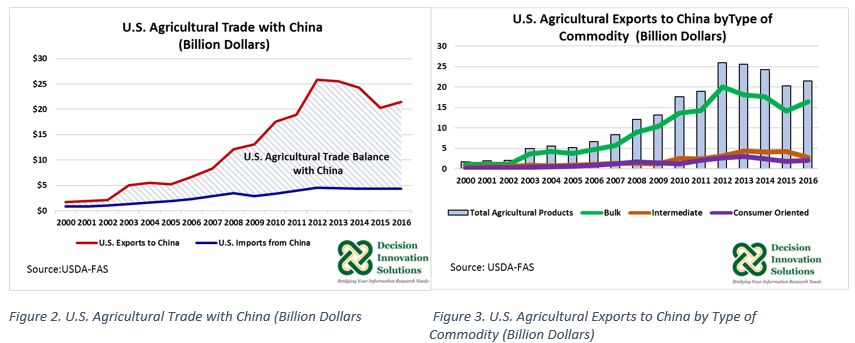
As Figure 2 shows, the United States is a net exporter of agricultural products to China (i.e., the value of U.S. agricultural exports to China is greater than the value of U.S. agricultural imports from China). In 2016, the trade balance (exports minus imports) reached a value of $17.1 billion, increasing 7.4% from the previous year ($15.9 billion). As Figure 3 indicates, most of the U.S. positive trade balance with China is generated by the large value of U.S. bulk agricultural products exported to China. More specifically, the positive agricultural trade balance with China have been generated mostly by the sales of U.S. soybeans to that country (see Figure 4).
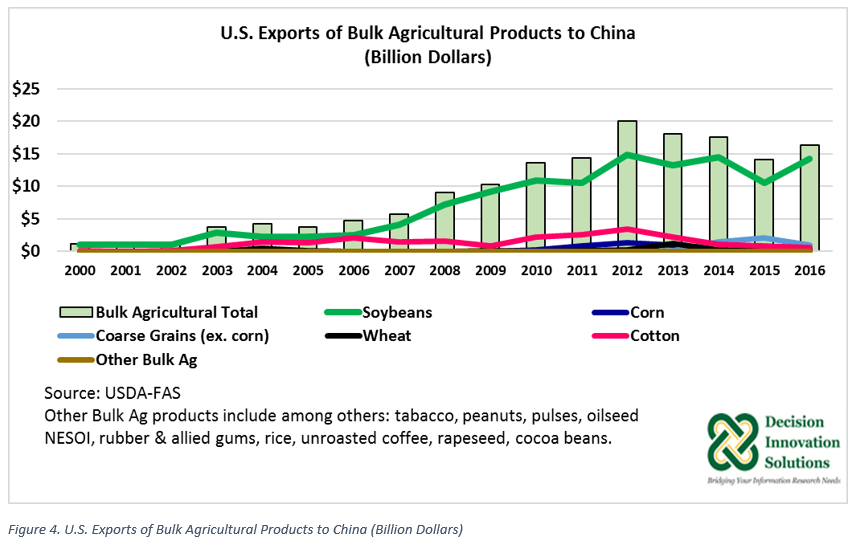
U.S. Exports of Bulk Agricultural Products to China
With China’s expansion in domestic meat and poultry consumption, domestic production of animal protein, particularly pork, increased over the last decade, bringing more land into corn production to supply their domestic need for corn as a feed ingredient. At the same time, a decline in harvested area for soybean production has intensified the import demand for other feed ingredients, particularly soybeans, to support the domestic meat and poultry industries. Over the last 10 years, on average, U.S. soybean exports to China have represented 58.3% of U.S. total agricultural exports to that country, and in 2016 two-thirds ($14.2 billion) of all agricultural exports to China were generated by U.S. soybean exports. The 2016 U.S. corn export value to China declined 68.3% to $59.2 million year over year. 2016 Chinese agricultural policy changes ended the floor price for corn, a price support policy. The policy has brought lower Chinese domestic corn prices making corn imports less attractive.
Overall, in 2016 U.S. total bulk agricultural product exports to China represented 76.5% ($16.4 billion) of U.S. total agricultural product exports to that country. 2016 U.S. soybean exports to China represented 86.6% of 2016 U.S. total bulk agricultural product export to China (see Figure 4).
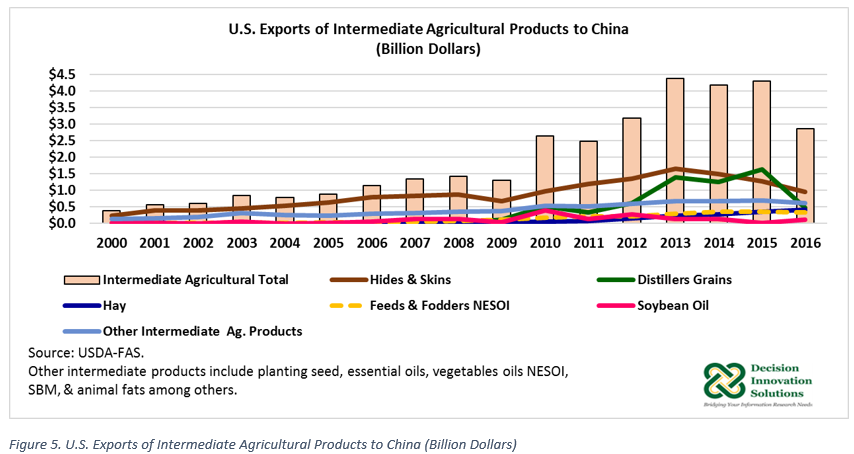
U.S. Exports of Intermediate Agricultural Products to China
U.S. exports of intermediate agricultural products to China declined 33.3% to $2.9 billion in 2016 compared with the 2015 value, mostly on account of the large plunge that U.S. distillers dried grains with solubles (DDGS) exports took last year (see Figure 5). U.S. DDGS exports to China in 2016 fell 70.8% to $477 million (2.4 million metric tons) compared with the value in 2015 ($1.6 billion, equivalent to 6.5 million metric tons). Despite this decline in exports, China continued as the top market for U.S. DDGS in 2016. China’s anti-dumping duties and the initial determination of countervailing duties on U.S. DDGS exports have negatively impacted U.S. DDGS trade with China. According to the U.S. Grains Council, China imposed preliminary an anti-dumping duty of 33.8% against U.S. DDGS and a countervailing duty of 10% to 10.7% back in September 2016. In a final ruling in January 2017, China raised the DDGS anti-dumping duty to 42.2% to 53.7% and the DDGS countervailing duty to 11.2% to 12%.
Over the last 10 years, on average, DDGS exports to China have represented 22.4% of the 10-year average value of intermediate agricultural products exported to China ($2.8 billion) and 3.4% of the 10-year average U.S. total agricultural products to China ($18.4 billion). China also had a tentative tariff rate of 5% for denatured ethanol (HS 22072000) in 2016; however, the rate was restored to 30% starting January 1, 2017.
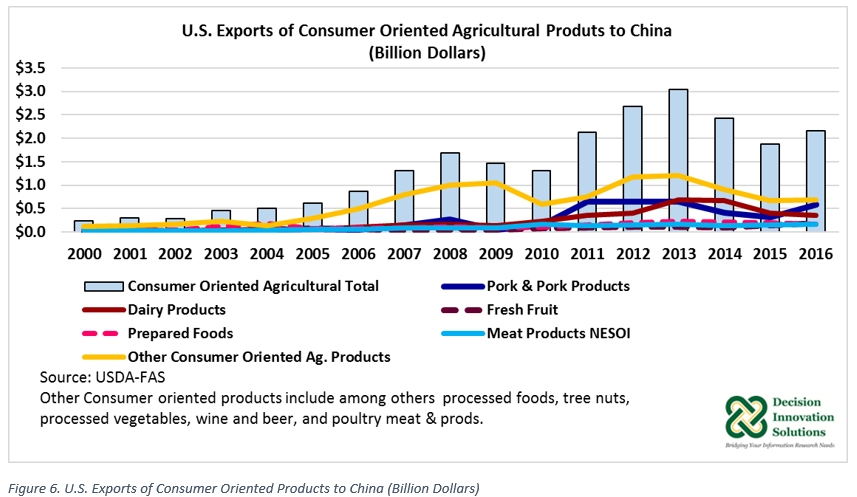
U.S. Exports of Consumer Oriented Agricultural Products to China
China is the largest pork producer and consumer in the world, however China’s pork production has declined over the past two years. Production fell 3.2% in 2015 and 5.5% in 2016 relative to the level of production during their corresponding previous years, amidst higher pork production costs and more stringent environmental regulations enacted at the beginning of 2015. As a result, China’s pork imports from all sources grew 35.2% and 133.2% in 2015 and 2016, respectively, to meet the domestic pork demand. Most of the expansion in China’s pork imports was capitalized by the EU due to large supplies, low prices, and favorable exchange rates; however, in 2016 U.S. pork and pork product exports to China increased by 81.5% to $578 million from the value in 2015 ($318.6 million) (see Figure 6). In 2016 U.S. exports of pork and pork products to China represented 27% of 2016 U.S. total consumer oriented agricultural product exports to China ($2.2 billion). Overall, 2016 U.S. exports of pork and pork products to China was 3% of 2016 U.S. total agricultural product exports to China.
An increase in China’s domestic hog and pork prices following two years of falling Chinese production is expected to encourage herd recovery and expansion in 2017, lowering import demand from 2016. Because Chinese domestic pork prices are expected to be high enough to encourage high levels of import demand from all sources, U.S. pork exports to China are still expected to increase in 2017.
The economic growth experienced by China over the last decade has allowed expansion of U.S. agricultural trade with China. China’s economic growth has slowed down in recent years but Chinese feed demand is expected to remain strong. Chinese agricultural policy changes that have been taking place since last year have had a negative impact on some U.S. agricultural products exported to China in 2016; nonetheless, the United States remains a net exporter of agricultural products to China, mainly due to the strong Chinese import demand for U.S. soybeans.
- china
- exports