

California Low Carbon Fuel Standard (LCFS) went into effect in 2011. In 2016, the state of Oregon launched the Oregon Clean Fuels Program (Oregon CFP); and the state of Washington started its Clean Fuel Standard on January 1st, 2023. Clean fuels/energy standards or programs in 12 other states have been proposed to the state governments[1], i.e., Illinois, Minnesota, New Mexico, New York, Pennsylvania, Colorado, Massachusetts, Hawaii, Ohio, Nebraska, Vermont, and Michigan. These standards/programs are targeting to reduce the amount of greenhouse gas generated during production, processing, transportation, and/or consumption (i.e., life cycle) of fuels used in these states. For some states, energy used for transportation is their main target.
The California LCFS aims to achieve a 20% reduction in carbon intensity of transportation fuels below the 2010 level by 2030. Oregon’s CFP requires a 20% reduction in carbon intensity from the 2015 level by 2030. All other states are aiming for a 10-30% reduction in carbon intensity for the next decade.
The state clean fuels/energy programs define carbon intensity (CI) scores for each individual fuel type. Fuels with lower CI include ethanol, biodiesel, renewable diesel, electricity, and renewable natural gas. A fuel generates credits if the fuel’s CI level is below the mandated average CI. In contrast, a fuel generates deficits if the fuel’s CI level exceeds the mandated average CI, in which case deficits must be balanced with credits generated by lower CI fuels. The quantity of credits/deficits generated by each fuel is in direct relation to the fuel’s CI level relative to the annual decreasing mandated average CI, and how much of the fuel is used in each of the states.
Figure 1 and Figure 2 show credits share from biodiesel, fuel ethanol, and renewable diesel in California and Oregon, respectively. Fuel Ethanol was the top clean fuel in use at the beginning of the CFPs in both states, but it has declined dramatically over the years.
In California, 63% of the credits were from ethanol in 2011, while the ethanol share dropped to 5% in 2022. Renewable diesel generated more credits than any other clean energy in 2022, about 15% of total credits. Biodiesel became the top contributor to the credit pool in 2015, which was about 13% of total credits. But it has gone down gradually after the year of 2015.
In Oregon, the credits share from ethanol decreased from 62% in 2016 to 27% in 2022. Credits from renewable diesel increased steadily from zero to 19% in 2022. Credits from biodiesel maintained the same level from 2016 to 2022, at about 30% of the total credit pool.
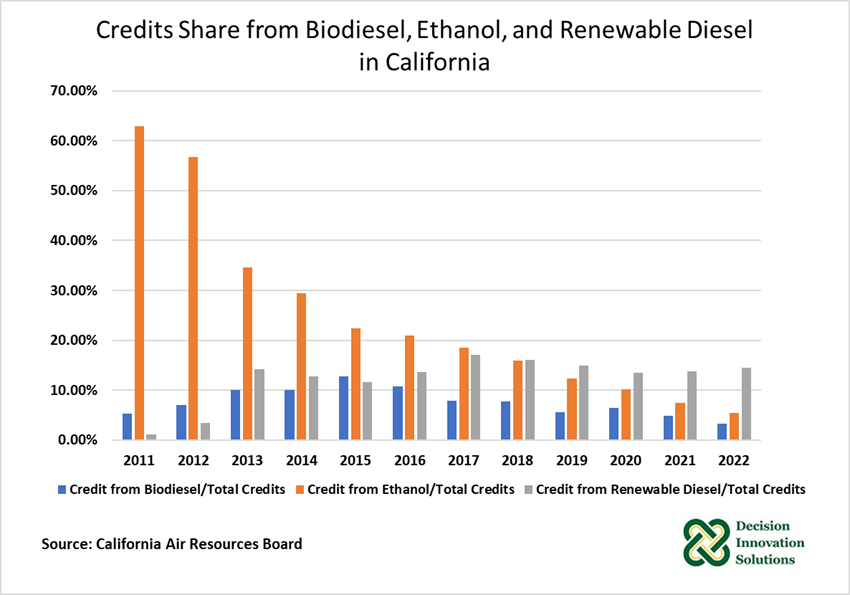
Figure 1. Credits Share from Biodiesel, Ethanol, and Renewable Diesel in California
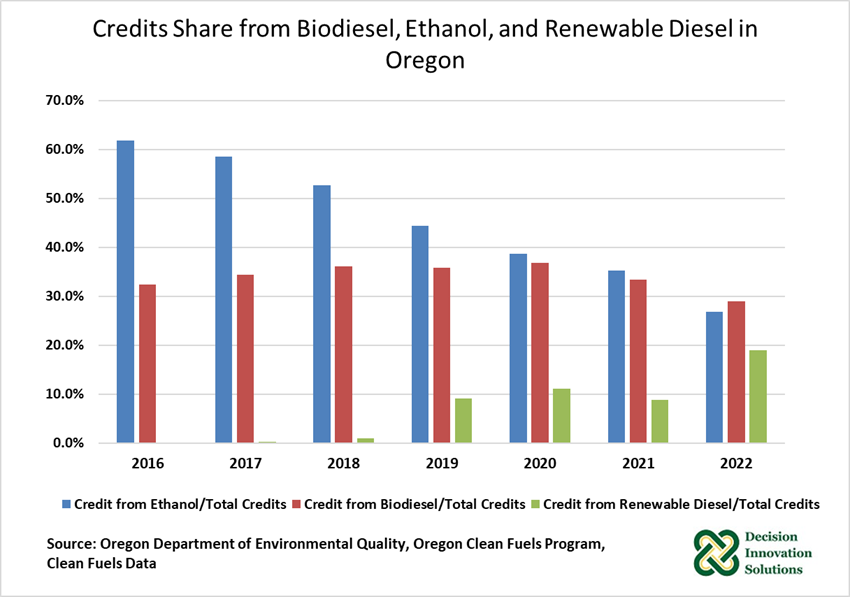
Figure 2. Credits Share from Biodiesel, Ethanol, and Renewable Diesel in Oregon
Data for biodiesel production started from 2001, corn crush for fuel ethanol data started from late 2014, and renewable diesel production started since 2011 in the U.S. Production details report. Data for the U.S. is shown in Figure 3. Renewable diesel production grew more than 8 times and biodiesel production increased 27%, compared to 2014 productions, respectively. Corn crushed for fuel ethanol maintains at the same level before the COVID pandemic (from 2015 to 2019, not comparing corn used for fuel ethanol to 2014, since data for corn used for fuel ethanol started the last quarter in 2014.) After the pandemic, corn processed for fuel ethanol has risen gradually, but is still below the recent record level seen in 2018.
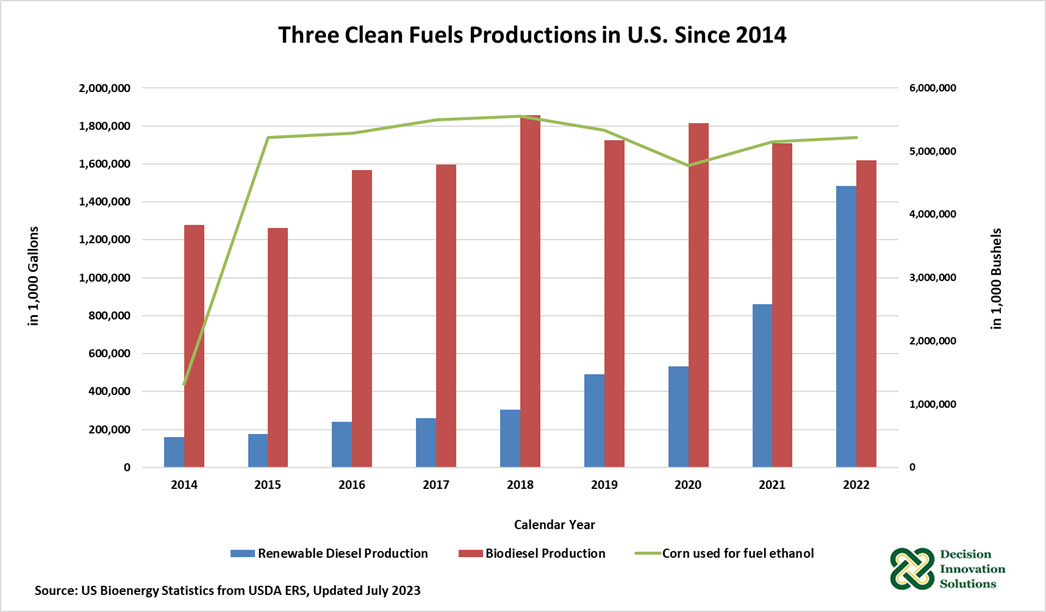
Figure 3. Renewable Diesel, Biodiesel Production, and Corn Crush for Fuel Ethanol in U.S. since 2014
Iowa had the most biodiesel and fuel ethanol production plants in the United States as of 2022, as published in Bioenergy Statistics from USDA ERS. There were 11 biodiesel plants and 41 fuel ethanol production plants with 470 million gallons per year (21% of US total biodiesel production capacity[1]) and 4.7 billion gallons per year (31% of US total fuel ethanol production), respectively. And while there is no renewable diesel production in Iowa, national renewable diesel production capacity was estimated to be 1.751 billion gallons and national production capacity utilization was 84.6%.
Estimated production details for biodiesel production and corn crush for fuel ethanol in Iowa is shown Figure 4. Corn crush for fuel ethanol dropped 10% from 2019 to 2020, due to the COVID pandemic, then it recovered back to 2015 level in 2022. DIS has had a series of blogs that covered Iowa’s ethanol gross production margin, the latest one is published here.
For biodiesel production, Iowa saw an increasing trend from 2014 to 2018, then, in general, after 2018, biodiesel production went down from 1.72 million gallons in 2018, to 1.62 million gallons in 2022. Also, another series of blogs have talked about U.S. biodiesel production and feedstocks usage and can be found here.
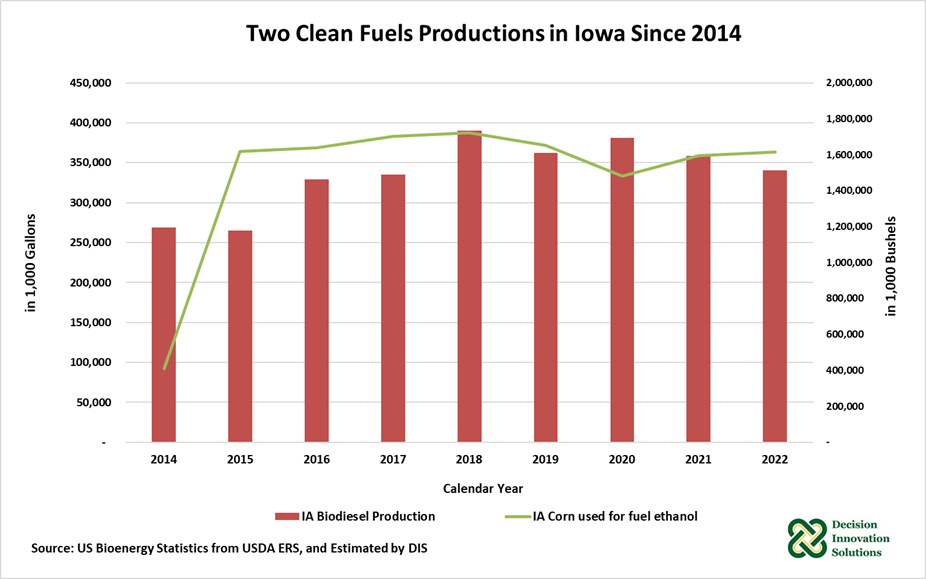
Figure 4. Biodiesel Production and Corn Crush for Fuel Ethanol in Iowa, since 2014
The demand for biodiesel is growing since more states are planning to participate in clean fuel programs. Though the credits from ethanol dropped down, in both CA and OR, over the years, and the trends may be followed by the other 12 states, fuel ethanol demand by volume hasn’t changed significantly in recent years. As the top producer of biodiesel and ethanol, Iowa is likely to remain a major producer (and supplier) of biodiesel and fuel ethanol to the U.S. in the next decade.
[1] U.S. biodiesel production in 2022 utilized just 71.8% of national biodiesel production capacity.
[2] https://e-missioncontrol.com/about-e-mission-control/pending-states/