posted by Jing Tang on Saturday, January 7, 2023
Introduction
Feed usage by major animal species is one of the most important demand segments for agricultural commodities in the United States. Beginning in 2014, DIS summarized, with some calculations, rations and feed usage from independent nutritionist consultants for different species. Beginning in 2019, our team realized that in some cases our ingredient usage estimates were higher than what was domestically available, while for a few other ingredients, only a small portion of total available was assumed to be fed. To overcome the errors of under and overutilizing feed ingredients, the RCO model (Ration Cost Optimization model) was developed. Using this new methodology, we now have a better understanding of estimated feed ingredients utilization by state and by species, without over or underutilizing feed ingredients based on total U.S. feed availability.
The following steps are used when estimating the rations for major livestock, poultry and companion animal species:
- List the possible feed ingredients for a given species, for all studied species: Beef Cattle, Dairy Cattle, Broilers, Layers, Turkeys, Hogs, Sheep, Goats and Horses.
- For a given species, use and allocate USDA published price points for all relevant feed ingredients plus estimated transportation costs to the center of each state to estimate the total delivered cost for the various feed ingredients. For feed ingredients with more than one pricing point, transportation costs from all pricing points to the center of each state are calculated and the lowest delivered cost is used as the estimated cost of that ingredient for that state.
- For a given species, the production phase is divided into different growth stages according to National Research Council (NRC) categorization.
- Hogs are broken into seven growth-stage groups: 5-7kg, 7-11kg, 11-25kg, 25-50kg, 50-75kg, 75-100kg and 100-135kg groups
- Sows are divided into gestation and lactation groups.
- Nutrient requirements (e.g., energy, crude protein, amino acid, fat, and fiber) for all stages are determined using the NRC manual.
- For a given state/region, apply unique ingredient limitations to mirror reality. For example, barley will likely be used in hog rations in northern and western states such as Minnesota and Montana but not in Florida; poultry byproduct meal is more likely to be used to a greater degree in southeastern states than in northern states Montana.
-
Apply ingredient constraints based on growth stages for a given species to mirror current production practices. For example, in the early stages rations of marketing hogs (i.e., 5-7 kg and 7-11 kg groups), the soybean meal inclusion rate is higher than it is in later growth phase rations.
-
Apply feed ingredient costs, the nutrient requirements and ingredient constraints into the ration cost optimization tool (using the Solver function of Microsoft Excel) to find the optimized cost of each feed ration for all stages, for a given state/region, and for a given species while meeting nutrient requirements and within the constraints of ingredient availability.
-
Allocate additives such as minerals, salt, vitamins, etc. on a parts-per-million (PPM) basis.
-
Calculate weighted-average ration, by stage, if necessary, for a given state/region and for a given species.
-
Apply weighted average ration to corresponding animal numbers, which may include estimates for unreported or non-disclosed data1 to determine the volume of ingredient used for each species in each state.
-
Summarize the quantities for a given ingredient for all states for each species.
-
Summarize all feed ingredients for all species to estimate national utilization totals by ingredient and reconcile all feed ingredients for all species based on national total availability taking into account Subject Matter Experts’ comments.
-
Complete any optional analyses desired by clients such as considering subsets of ingredients (like organic, or high oleic soybean products), impacts of higher inclusion rates for specified ingredients, or other specific ingredient constraints to meet client’s needs.
Examples
DIS has completed multiple projects using the RCO model. These include:
- Calculation of feed ingredients usage/demand by state for all the major species, (i.e., Beef Cattle, Dairy Cattle Broilers, Layers, Turkeys, Hogs, Sheep, Goats, and Horses), for a given year. Examples of an annual feed use assessment can be found here and here.
- A feed demand study using the output of the annual feed utilization study as a baseline, then applying different constraints on the ingredients such as minimizing greenhouse gas emissions while still meeting the nutritional requirements of all species.
- Analysis of the impacts of anticipatory increases in the supply of specific ingredients and the impacts on utilization of that ingredient by species and the anticipated utilization response of other ingredients.
- Analysis of the impacts of changes in inclusion rates of a specified ingredient in the rations of selected species and the impacts of these changes on other total ingredient use of the specified ingredient as well as the estimated utilization response of other ingredients.
In Addition to applying the RCO model to the major livestock and poultry species, the RCO model has been applied to pet2 food analysis. Similar to the feed demand studies there are constraints which in this case are nutrient requirements for pets and ingredient position on pet food labels3 . The RCO model is then applied to estimate a pet food ration with a relative low cost for a given pet food product. For a given pet food type, dry food, wet food or treats, rations vary among pet food manufacturers and among the branded products within a manufacturer. DIS has studied about 2,500 cat foods, and more than 6,300 dog foods and has estimated the total use by ingredient by type of pet food for roughly 350 food ingredient categories and more than 650 uniquely labeled food ingredients.
An Example of Results of the RCO Livestock Model
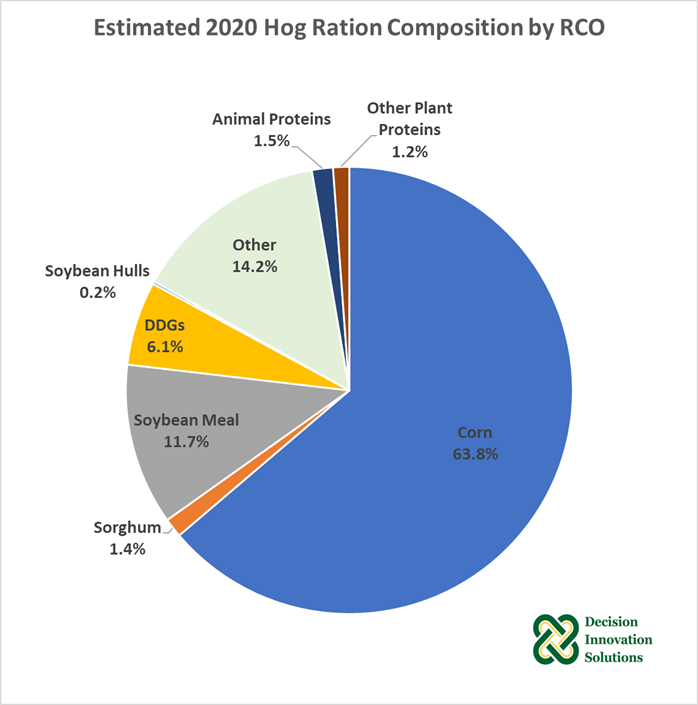
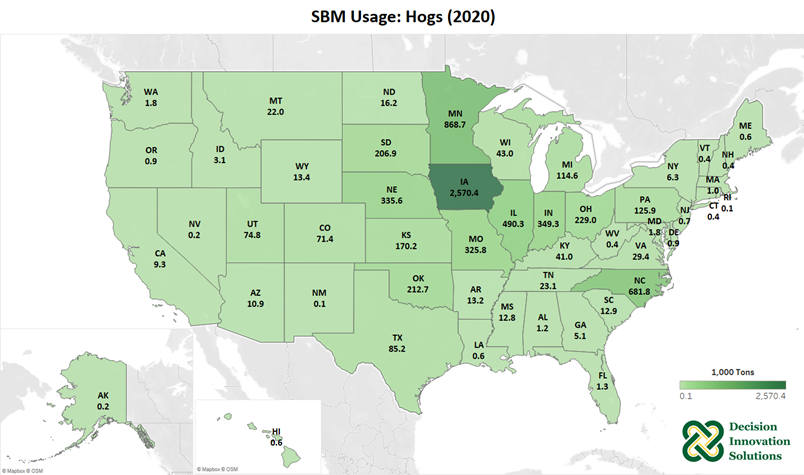
Below are examples of results ration from the hog-ration data from the feed demand study for 2020, summarized into national level.4 The pie chart below shows a national-average hog ration, and the top five ingredients, by volume, are corn, soybean meal, corn DDGs, hominy feed, wheat middlings, and wheat, for the year 2020. The map below shows soybean meal usage for hogs by state for 2020. The top five soybean meal consumption states are Iowa, Minnesota, North Carolina, Illinois, Indiana, and Nebraska.
Potential Applications
Beyond what the DIS team has done so far, the RCO model could also be applied to other situations. These include:
- Adding additional supplements into a ration could satisfy some of the nutrient requirements using less main feed ingredients (by volume), calculated by RCO model.
- For instance, amino acid requirements, such as lysin or threonine, could be satisfied by adding soybean meal or meat and bone meal. But the requirements can also be met by adding lysine or threonine amino acids supplements.
- If some of the supplements are pre-added into the ration at a specified concentration or percentage, and the ingredient constraints are reset, then the RCO could select other main feed ingredients necessary to meet the nutrient requirements and the inclusion rates of soybean meal and/or meat and bone meal would be altered.
- Furthermore, the RCO also could be used to analyze different scenarios by changing ingredient constraints. For instance, a certain type of additive or treatment needs to be added into a ration, but the optimized concentration needs to be determined in order to minimize the ration cost. For instance, a certain type of additive or treatment needs to be added into a ration, but the optimized concentration needs to be determined in order to minimize the ration cost. At least three scenarios could be set up.
- One is to add the minimum concentration of the treatment that has the desired treatment effect into the ration, then combine nutrient requirements and regional ingredient constraints, let RCO select the other feed ingredients.
- A second scenario is to add a reasonable “maximum” concentration of the treatment, say 2% of the ration, into the ration, then do the same as the first scenario.
- Last one is to add a certain level of the treatment, maybe average of the minimum and the maximum -- depending on the experiment -- then let the RCO do the same as in the other two scenarios.
[1] For each species, inventory and/or production numbers are available in monthly and/or annual reports produced by USDA-NASS. These reports may aggregate data from some states into “other states” listings in the report. DIS uses a proprietary methodology to allocate “other states” data to the individual states that were aggregated.
[1] Here, pet refers to only cats and dogs
[1] Ingredient must be labeled in a descending order based on its volume in the final product, according to food labeling regulations, by FDA.
[1] State-level results can be reported, if desired.
Summary
As described above, the RCO model has been and continues to be utilized in many different situations to help our clients have a better understanding of feed rations for major animal species, which has been demonstrated by successfully using it with several satisfied clients.
For a more detailed discussion of the DIS RCO model, please contact Spencer Parkinson at 515-639-2900 or spence@decision-innovation.com