posted by Jing Tang on Tuesday, July 16, 2019
“Planting progress has been slowed by relatively frequent and relatively heavy rains throughout April and May.”, said DIS chief economist, David Miller, on May 24, 2019. (Blog is originally posted here) These abnormal weather events affected a number of rivers with flooding in the Midwest area, which led to delays in the corn planting process. That is one of the main reasons that the July corn futures prices went up 14.5% over the past 10 days. On May 17th, the July corn futures price was $3.80/bu; while on May 31st, it was up to $4.34/bu. In this article, we will focus on the behaviors of ethanol gross production margin (GPM) in 2019 along with the abnormal changing of corn prices, especially during the 2019 summer season.
The GPM, in the ethanol industry, commonly represents the difference between the combined sales values of ethanol, distiller’s dried grains (DDGS) and distillers corn oil (DCO), and the price of corn. All data came from USDA-AMS weekly report, Iowa ethanol corn and co-products processing values. The latest data was updated on July 12, 2019. GPM calculation shows the calculated relationship between values of ethanol and ethanol co-products and the cost of corn in ethanol production.
Figure1 shows the monthly average Iowa ethanol GPM for the years 2018 and 2019, in solid line and dashed line, respectively. Also, it shows the three-year average (2016 to 2018) Iowa ethanol GPM for each month. Since July 2018, the monthly GPMs have been below three-year average values. From May 2019, the margins were getting smaller due to higher corn prices. The GPM was $1.24 per bushel of corn in June 2019, compared to $1.99 a year ago. The values of ethanol, DDGS, and DCO in June 2019 were $4.10, $1.16, and $0.15, respectively. While those co-products’ values in June 2018 were $3.94, $1.35, and $0.13, respectively. Only the DDGS value is lower in 2019 than in 2018, the other two products’ values are higher in 2019 compared to 2018. But, because the 22% increase in corn price, from $3.43/bu in June 2018 to $4.17/bu in June 2019, the GPM is much smaller in June 2019 than in June 2018.
.PNG)
In Figure 2, the scatter points represent the weekly sales values (raw data from the AMS weekly report) for corn, ethanol, DDGS, and DCO using green, yellow, blue, and red color, respectively. For instance, in the May plot, the top yellow point corresponds to the ethanol sale value (gross value of ethanol sold per bushel of corn), $4.37, at Week #21, 2016. The boxplots in pink color, represent the range of weekly IA ethanol GPMs. Still using the May plot as an example, the first box shows that the GPMs in May 2016 were in the range from $1.72/bu to $2.00/bu. The study period is only for summer months, i.e., May, June and July in 2016 to 2019. By using ANOVA and Tukey-HSD test1, we found that the GPM numbers in 2019 are significantly lower compared to the previous three years, for all summer months. The GPM in July 2016 is significantly higher than the other July’s GPMs.
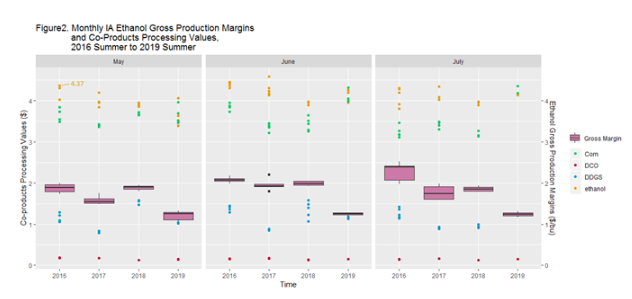
Applying the Pearson correlation test2, we find that from 2016 to 2019, in the month of May, ethanol and DDGS’s sale values provide significant positive influence on the GPM number. In the month of June, only corn price has had significant negative effect on the GPM. And in the month of July, corn price still has a significant, negative effect on GPM, but the sale value of DDGS has a significant, positive effect on GPM. Overall, regardless of month, higher corn prices have a significant, negative effect on GPM, while the ethanol sale values have a significant, positive effect on GPM.
In summary, with corn prices dramatically increasing within the past two months, while ethanol, DDGS, and DCO sale values have remained at a relatively stable level, the GPM has significantly declined.
1. ANOVA and Tukey HSD test: The one-way analysis of variance (ANOVA) is to evaluate whether there is any significant difference among group means. The Tukey HSD is following the ANOVA test to exam which group’s mean is significantly higher/lower than others.
2. Pearson correlation test: a test that measures the significance for a statistical relationship, or association, or correlation between two continuous variables.