posted by Kade Grafel on Wednesday, February 21, 2024
IMPLAN’s newest dataset was released at the end of November 2023. This dataset, based on 2022 data, is the most recent snapshot of economic activity by industry at the national, state, and county level.
The US economy has changed significantly over the past few years, and this is reflected in the new IMPLAN data. In nominal terms, Gross Domestic Product (GDP) grew by $2.4 trillion between 2021 and 2022. Personal income increased by $546 billion, and employment grew by nearly 12 million[1].
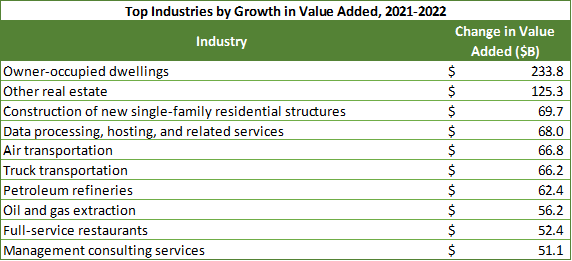
The below table shows the IMPLAN industries that experienced the highest growth in value added, which is equivalent to GDP, between 2021 and 2022. Owner-occupied dwellings, which represents the economic activity of homeownership[2], had the largest increase in value added of $234 billion. This is largely due to the increase in home values and interest rates that happened over this period. Oil and gas extraction, which had the largest value added growth last year, remains in the top ten. Other industries that experienced large growth include data processing and hosting, transportation, petroleum refineries, and restaurants.
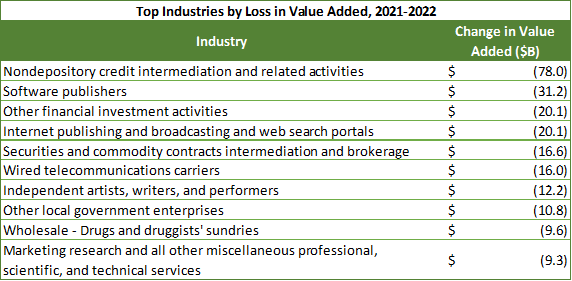
Many industries lost value added between 2021 and 2022. Those with the greatest losses include several financial industries, software publishers, telecommunications carriers, and drug wholesalers.
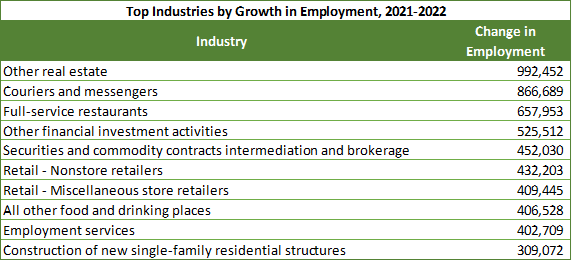
The ten industries that hired the most new employees account for nearly half of all employment growth, with a combined increase of nearly 5.5 million jobs. Some of the fastest hiring sectors are restaurants and other food services, retail shopping, couriers, and real estate. Interestingly, the “securities and commodity contracts intermediation and brokerage” and “other financial investment activities” industries had some of the largest increases in employment despite having relatively large negative changes in value added.
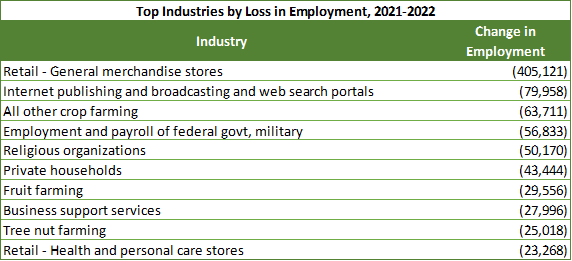
Of course, some industries lost jobs between 2021 and 2022. The industry with the biggest loss was general merchandise retailers. Several farming sectors experienced reductions in employment, such as fruit farming, tree nut farming, and other crop farming, which includes hay, grass, herb, and peanut farming.
[1] Employment in IMPLAN is defined differently than other common employment statistics. For example, IMPLAN employment includes farm jobs and counts all jobs equally regardless of their full-time equivalence.
[2] This industry reflects money spent by homeowners on home upkeep and maintenance, the interest portion of mortgage payments, and property tax payments.