posted by Kade Grafel on Monday, September 11, 2023
The past several years have been a turbulent period for international trade. With a pandemic, a major trade conflict, a war in Europe, and other weather- and supply chain-based disruptions, there has been no shortage of events causing major changes to the flow of goods around the world. Nearly every industry in the U.S. has been affected in some way by one or more of these events, and agriculture is no exception. The flow of U.S. grain and oilseed exports have changed since 2015, and this can affect the port through which these products leave the county.
The U.S. Census Bureau publishes trade data by port district. Note that the values shown do not equal total exports for each commodity, as exports over land (to Canada and Mexico) are not present in this dataset.
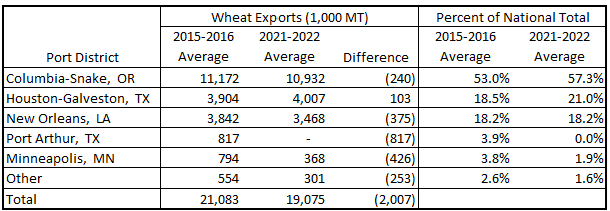
Table 1 shows a summary of wheat exports by port district for 2015-2016 and 2021-2022. A 2-year average was used to help mitigate any single year outliers, while a 3-year average was not used as it would incorporate the anomalous data from 2020. Wheat exports continue to be concentrated in three main ports: New Orleans, Houston, and the Columbia River in the Pacific Northwest (PNW). Combined, these three districts make up 90% of all seaborne exports in 2015-2016, and this concentration increased to nearly 97% in 2021-2022. While Port Arthur in Texas exported an average of 817,000 metric tons of wheat in 2015-2016, it had no exports in the most recent 2-year period. Exports moving through the port district of Minneapolis[1] are less than half of what they were in the 2015-2016 average.
Table 1. Wheat Export Summary by Port District
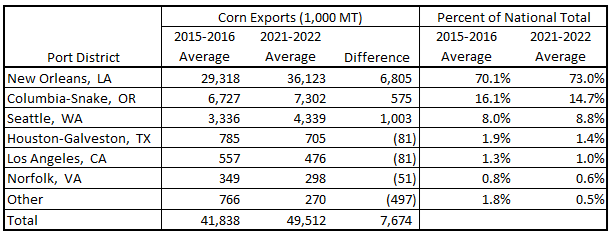
The U.S. exported an average of 7.7 million metric tons more corn in 2021-2022 than it did in 2015-2016. This increased volume was exported entirely through the Louisiana Gulf and the PNW. Less corn in both absolute and relative terms was exported through “secondary” ports (Houston, Los Angeles, and Norfolk) in 2021-2022 compared to 2015-2016 (Table 2).
Table 2. Corn Export Summary by Port District
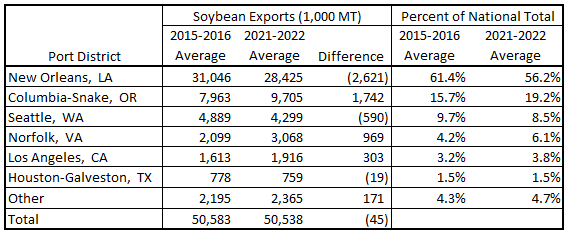
While recent years have been particularly volatile for soybean exports, total exports of U.S. soybeans in 2021-2022 are at essentially the same level as in 2015-2016. While the total quantity is the same, the distribution of soybean exports has changed significantly. Soybeans exported through New Orleans have declined by 2.6 million metric tons, or more than 8%. Many of these soybeans are instead exported through the Pacific Northwest, but other ports have also seen an increase. Soybean exports through Norfolk, Virginia increased by 969,000 metric tons, an increase of nearly 50%. Exports through Los Angeles increased by more than 300,000 metric tons, or around 19% (Table 3).
Table 3. Soybean Export Summary by Port District
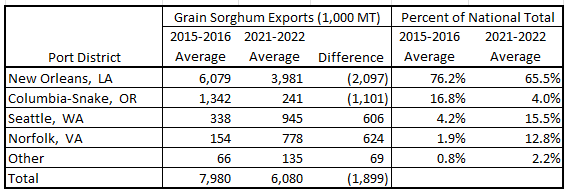
Grain sorghum exports are down by about 25% compared to the 2015-2016 average. This decrease is spread between the Louisiana Gulf and PNW, though there has been a shift of PNW exports away from the Columbia River and towards Seattle. Grain sorghum exports through Norfolk have increased substantially, from 2% of the national total in 2015-2016 to nearly 13% in 2021-2022 (Table 4).
Table 4. Grain Sorghum Export Summary by Port District
Whether due to diplomacy, shipping disruptions, or unforeseen external events, international trade flows are constantly changing. The flow of all U.S. crop exports has changed since 2016. While some crops have largely returned to their previous export flows, others have seen major changes that may persist for many years to come.
[1] Wheat moving through the port district of Minneapolis is actually exported through the Port of Duluth on Lake Superior.