posted by S. Patricia Batres-Marquez on Monday, October 15, 2018
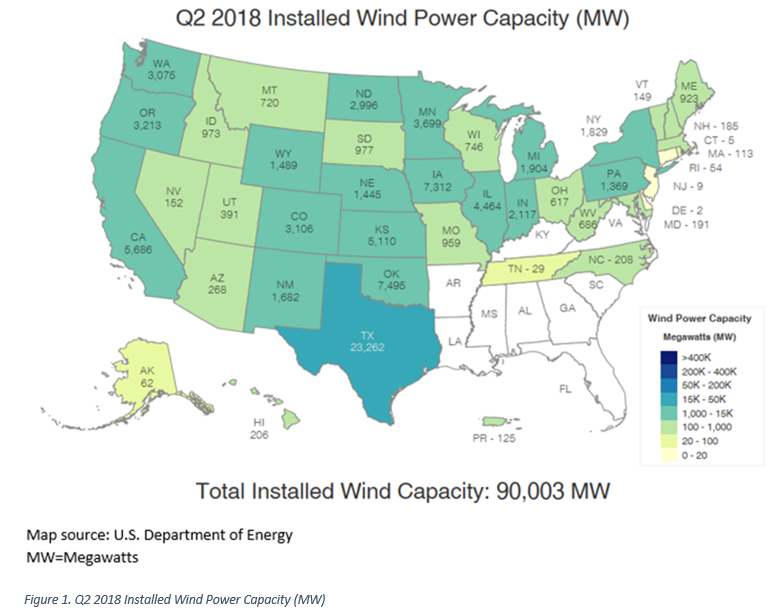
As of December 2017, Iowa wind power capacity installed was equal to 7,308 megawatts. By the end of the second quarter of 2018, Iowa added 4 MW of new wind power capacity for a total of 7,312 MW. Based on the newest data from the U.S. Department of Energy, in terms of wind power capacity installed, Iowa is the third in the nation after Texas (23,262 MW) and Oklahoma (7,495 MW). However, Iowa leads the nation in per capita wind power capacity with 2,324 MW/million people. Oklahoma has 1,906 MW/million people and Texas has 822 MW/million people. Wind power capacity installed in Iowa represented 8.1 percent of total wind power capacity in the country (90,003 MW) (Figure 1) during the second quarter of the current year.
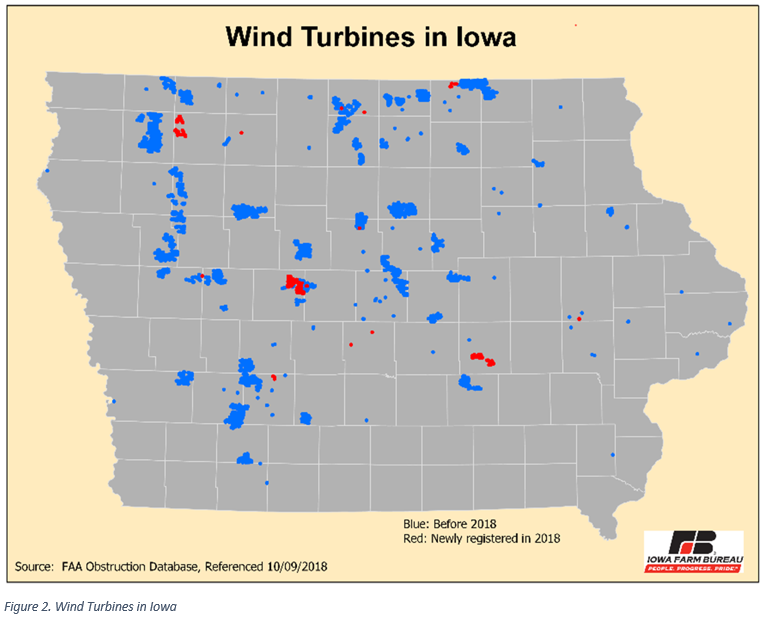
Based on the latest (October 09, 2018) Obstruction Database from the Federal Aviation Administration (FAA), there were 4,211 wind turbines in Iowa, including 182 new turbines installed this year. The database indicates 60 Iowa counties have wind turbines installed. Twenty eight percent of all turbines in the state are located in five counties: O’Brien (318 turbines), Hancock (239 turbines), Worth (231 turbines), Pocahontas (215 turbines), and Franklin (181 turbines). Overall, there are 18 counties in Iowa with more than 100 turbines installed. The counties with more added turbines so far this year are Green (85 turbines), Poweshiek (39 turbines), and Clay (37 turbines). With these additions the total number of turbines in these three counties increased to 156, 40, and 38, respectively. Figure 2 shows the location of wind turbines across Iowa. The blue dots in the map indicate turbines installed prior to 2018, while red dots show turbines added this year.
According to the American Wind Energy Association (AWEA), wind projects generate lease payments for landowners and increase the tax base of communities. 2017 AWEA data indicates, on average, the annual lease payment in Iowa was between $20 and $25 million. These lease payments were calculated based on national and state averages.
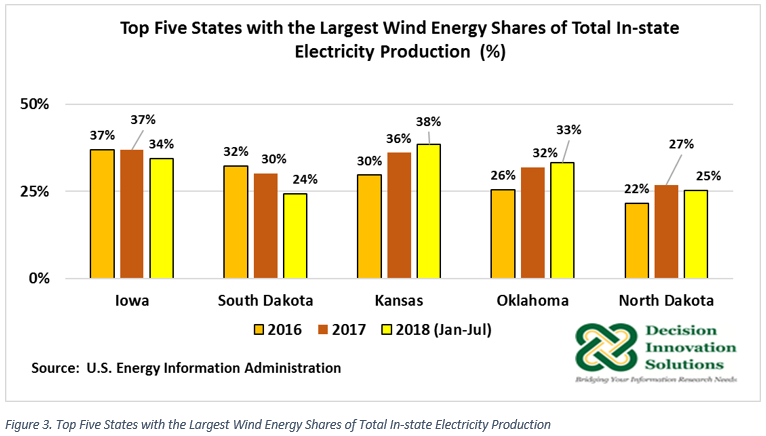
In 2017, Iowa ranked first in the country in terms of wind power generation relative to total in-state electricity production. Last year Iowa generated 20.82 million megawatt-hours from wind power and contributed 37 percent of the states’ electricity supply. Also, wind energy in Kansas, Oklahoma, and South Dakota supplied more than 30 percent of their in-state electricity generation (Figure 3). The latest data available corresponding to the first seven months of 2018 published by the U.S. Energy Information Administration indicates Iowa generated 12.63 million megawatt-hours in electricity and represented 34 percent of the total energy supply; however Kansas is taking the lead in wind energy generation so far this year with 38 percent of the in-state electricity supply (Figure 3). Texas, ranked number one in the country in wind energy installed capacity, generated 15 percent of its total in-state electricity in 2017. This share increased to 17 percent during the first seven months of the current calendar year. Overall, wind energy contributed 6.3 percent of the U.S. energy supply in 2017 and 7 percent during the first seven month of 2018.
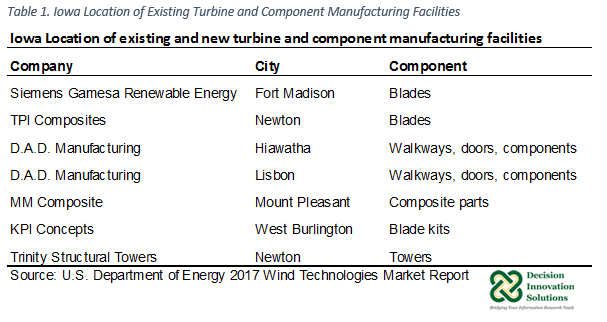
As indicated in the 2017 Wind Technologies Market Report by the U.S. Energy Department, there were about 150 wind turbine and component manufacturing and assembly facilities operating in the United States by the end of 2017. These facilities mainly concentrate on the utility-scale wind market. As show in Table 1, seven of those facilities were located in the state of Iowa and focused on the production of blades, towers, and other components for the wind industry (walkways, doors, and components).
Encouraged by favorable tax policies such as the federal production tax credit (PTC) and state policies known as Renewables Portfolio Standards (RPS), wind power additions continued in 2017 and 2018. PTC was last extended by Congress on December 2015. The extension was for a period of 5 years and it provided full PTC for projects that begun construction before the end of 2016. Projects started in 2017 received 80 percent of PTC. Projects starting in 2018 and 2019 will receive only 60 percent and 40 percent of the PTC, respectively. Based on the current schedule projects starting in 2020 and beyond will not receive the PTC. Discontinuation of the PTC may partially halt the progress completed so far in the wind industry.
RPS policies direct the location and amount of wind power development. As indicated by the American Wind Energy, Iowa became the first state to adopt a renewable portfolio standard after passing a law in 1983 requiring its major utilities to own or contract 105 MW of renewable energy. That requirement was met in Iowa in 1999 and has substantially surpassed it since then.
This report was originally published here: https://www.iowafarmbureau.com/Article/Iowa-is-a-Leader-in-the-Wind-Energy-Industry
- iowa
- wind energy