posted by Jing Tang on Friday, April 3, 2020
As a general rule, pets are considered “family” in the United States. More than 100 million U.S. families have a pet at home. For the one-year time period, June 2018 to May 2019, pet owners spent more than $30 billion on 9.8 million tons of pet food products. There are pet food manufacturing facilities in 42 of 50 states, which utilized 8.65 million tons of food ingredients with a value of $6.9 billion during the same time period. Pet foods produced in these facilities are diverse in quantity, type, and use a wide variety of ingredients. In many ways, the production, marketing, and health trends of pet food is similar to the food product trends of food eaten by pet owners. Quantifying the economic values that pet food brings to the U.S. economy and the agricultural industry greatly enhances our understanding of the importance of pet foods to both the pet food industry and to agriculture.
For a multi-client project, DIS studied the one-year retail sales data from Nielson. This data set contained more than 59,000 pet food records (8,197 for cat food and 40,966 for dog food) and represented about 70% of national data by volume. Figure 1 shows the distribution of pet food sales by volume (tons) and by value ($). Dry foods are the dominant products for both cat and dog foods. Due to its high cost per ounce, treats had a higher share of value than in volume for both cat and dog foods.
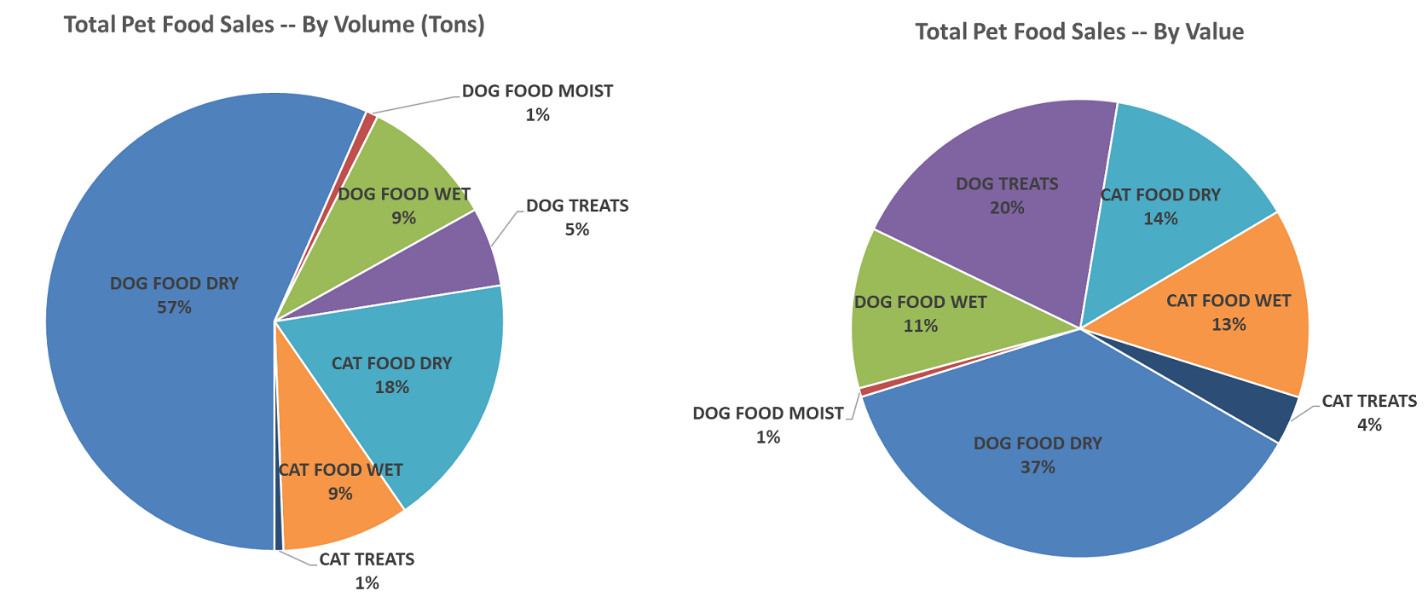
Figure 1. Distributions of Total Pet Food Sales by Volume (Tons) and by Value ($)
As shown in word clouds (Figure 2), the larger the font size of the words or phrases, the more frequently (not necessarily representing volumes) an ingredient shows up on product ingredient panels:
- For cat food products: chicken, meat by-product meal and liver are the top three most commonly used animal-based food ingredients; corn gluten meal, wheat gluten and brewers rice are the top three most commonly used plant related food ingredients.
- For dog food products: chicken, chicken fat and chicken meal are the top three most commonly used animal-based ingredients; flaxseed, peas and carrots are the top three most commonly used plant ingredients.
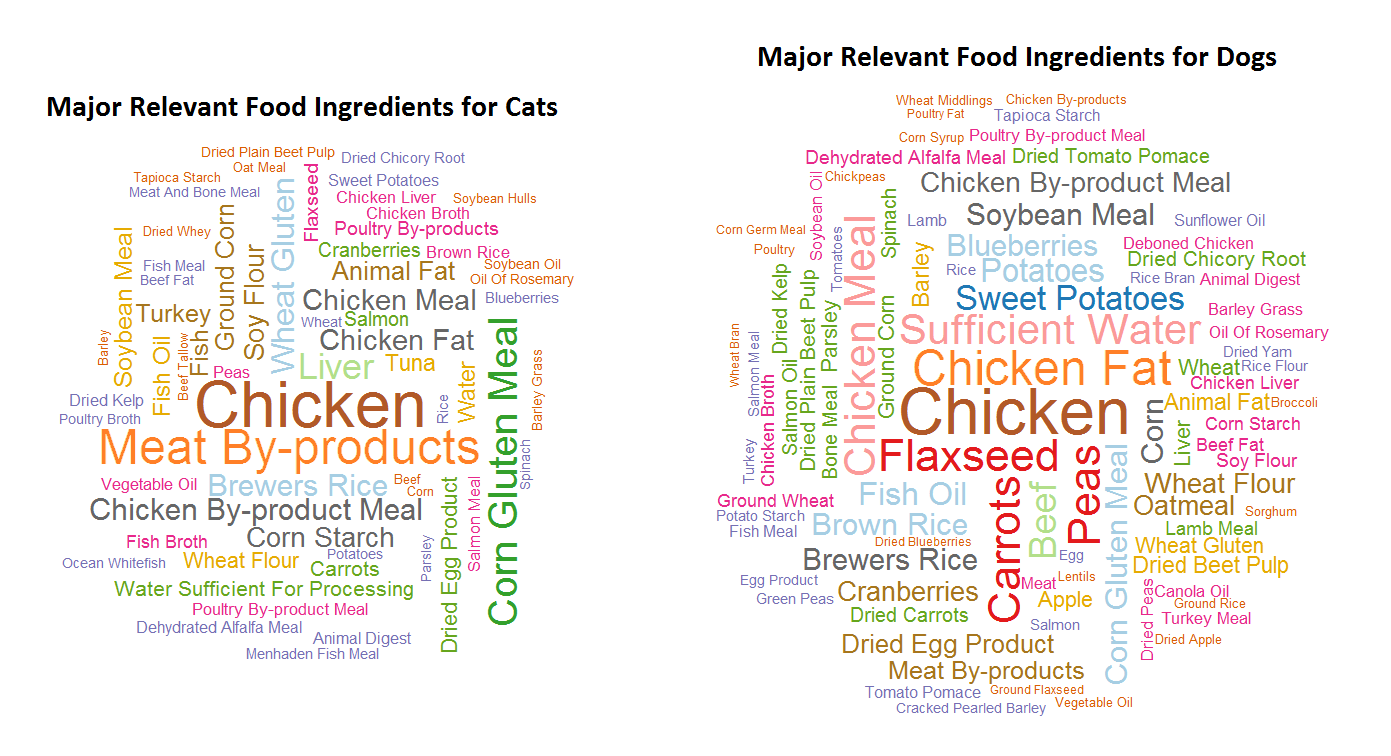
Figure 2. Major Food Ingredients for Cats and Dogs, by Mention on the Ingredient Label
In order to analyze “as sold” food ingredients volumes and values, we applied the following methodology:
- Applied a reverse engineering process on sampled pet food products.
- Obtained prevalence distributions of ingredients’ inclusion rates, based on the corresponding label placements and food types, with some conditions applied.
- Estimated the non-sampled products.
Upstream quantities (“as bought”) was estimated by doing the following:
- Adjusted moisture content based on food types, according to the “as sold” basis.
- Averaged national prices for each individual food ingredient.
- Aggregated food ingredients into 7 commodity types.
- Allocated food ingredient volumes and values based on each state’s share of direct output from pet food manufacturing sales (from the 2016 analysis that DIS conducted for Institute for Feed Education and Research).
During the study period, we found that:
- There were 8.65 million tons of food ingredients used in U.S. dog and cat food manufacturing with an ingredient value of $6.9 billion.
- There were 4.0 million tons of farm and farm-product processor ingredients valued at $1.4 billion.
- There are more than 3.8 million tons of animal-based products with a value of $4.6 billion used in dog and cat foods.
- There were 1.83 million tons of meat and poultry products valued at $3.1 billion.
- Rendered protein meals contributed 1.5 million tons with a value of $563 million.
- There were 289,037 tons of animal and poultry fats with a value of $153 million.
- Broth ingredients account for 166,851 tons with a value of $834 million.
- Fishery ingredients contributed 198,671 tons with a value of $893 million.
- Water and minerals contributed 571,164 tons with a value of $13.7 million.
- By weight, whole grains (1,869,087 tons) are the most used ingredients in dog and cat foods. This is followed by chicken (854,988 tons), meat and bone meal (635,652 tons), corn gluten meal (476,599 tons) and soybean meal (437,251 tons).
- By value, beef ($1.22 billion), lamb ($691 million), chicken ($650 million), salmon ($430 million) and chicken broth ($353 million) are the top five ingredients.
Figure 3 and Figure 4 (as examples) show total cat and dog food ingredient volume allocations based on the number of pets by state which shows the distribution of pet food ingredients as sold (Figure 3) and as bought (Figure 4). Due to large pet populations, the leading states for pet food consumption include Texas, California, and Florida. While the leading states for raw materials were from Missouri, Kansas, and Pennsylvania.
Click here for full version of the pet food production and ingredient analysis study report, or if you’d like to know more details, please contact us.
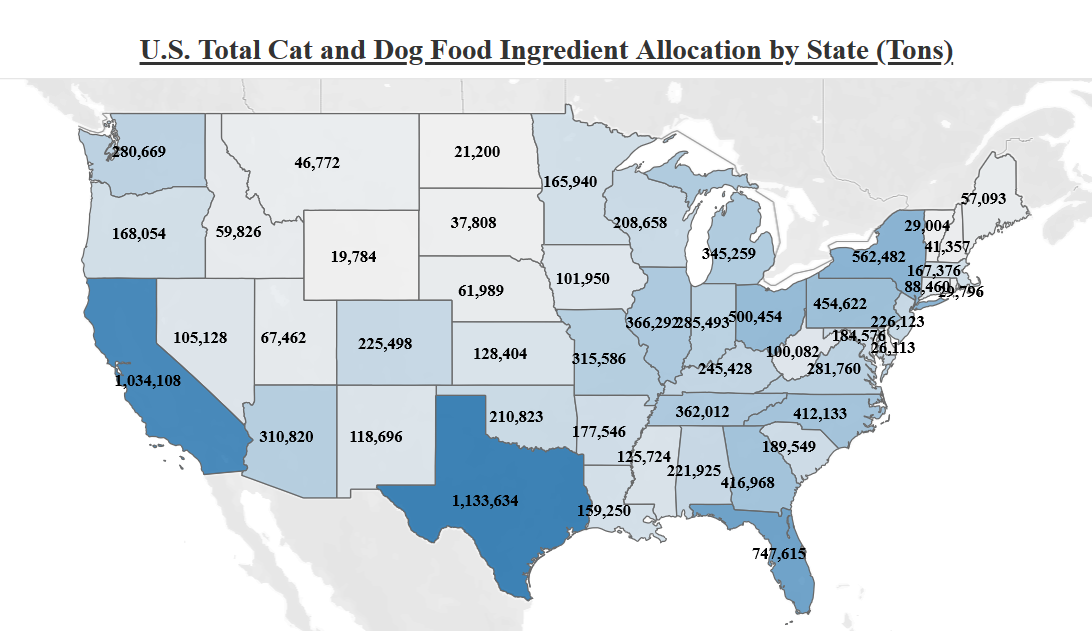
Figure 3. Total Food Ingredients in Cat and Dog Food, "As Sold", Allocation by State
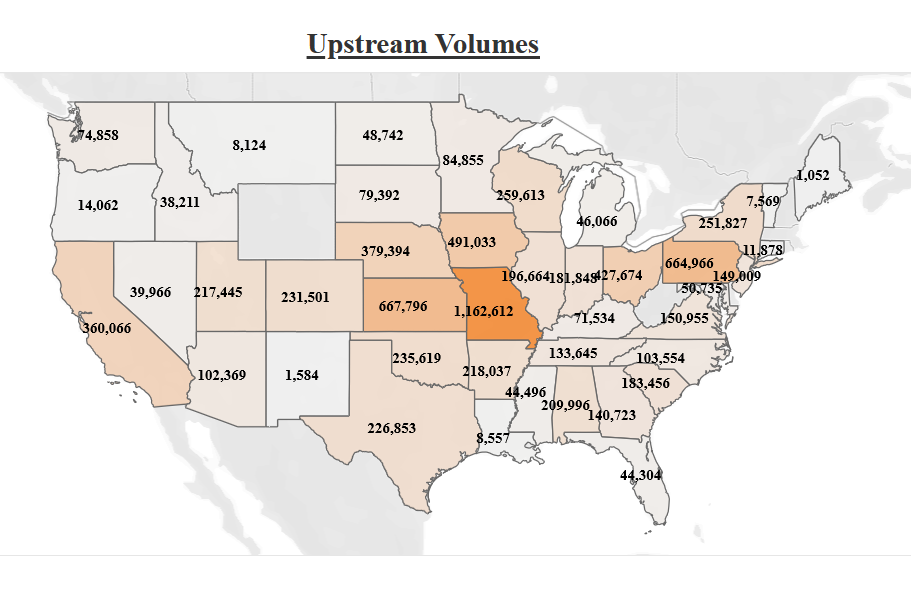
Figure 4. Total Raw Ingredients to Cat and Dog Food, "As Bought", Allocation by State