posted by S. Patricia Batres-Marquez on Friday, April 1, 2016
The Trans-Pacific Partnership (TPP) is a free trade agreement (FTA) negotiated among twelve countries: Australia, Canada, Japan, Mexico, New Zealand, Singapore, Peru, Chile, Brunei, Vietnam, Malaysia, and the United States. According to the Office of the United States Trade Representative (USTR), the TPP agreement seeks to bring new and effective market opportunities for American goods and services exports. The benefits of the TPP will occur through a combination of tariff reduction, tariff elimination, and new tariff rate quotas (TRQS). TPP has the potential to benefit American farmers and ranchers by supporting stronger commodity prices and increasing agricultural exports, which currently represent about 20% of all farm income in the U.S., in a region that represents about 40 percent of world GDP and has nearly 500 million consumers.
The TPP agreement will increase market access for U.S. agricultural products in countries not currently having a FTA with the U.S. (Japan, Vietnam, Malaysia, New Zealand, and Brunei), while enhancing market access in countries with established FTAs (Australia, Canada, Chile, Mexico, Peru, and Singapore).
The value of U.S. agricultural exports to the 11 TPP countries in 2015 equaled $57.2 billion, or 43% of all U.S. agricultural exports ($133.0 billion) (see Table 1). Canada is the top market for U.S. agricultural products with $20.9 billion, or 15.7% of U.S. agricultural exports in 2015.
Despite significant access barriers, Japan is already the fourth largest value export market for U.S. agricultural products, reaching a value of $11.2 billion or 8.4% of all U.S. Agricultural exports in 2015. According USTR, after TPP implementation, more than 50% of U.S. agricultural products (by value) will be exported to Japan duty free.
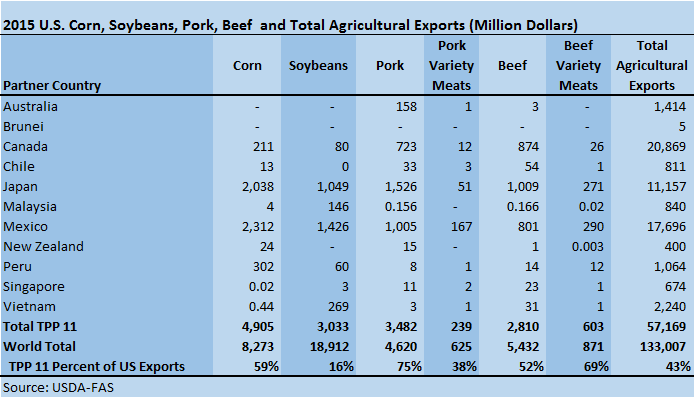
Table 1. U.S. Corn, Soybeans, Pork, Beef, and Total Agricultural Exports (Million Dollars)
Iowa and TPP
Through tariff reduction and opening/enhancing markets for American agricultural products, the TPP will help boost farm income, promote rural economic activity, and contribute to local jobs (USDA-FAS).
Iowa is the number one producer of corn, soybeans, and pork in the U.S. In 2014, six agricultural products comprised 84.4% of total value of Iowa agricultural exports ($11.3 billion), with soybeans and soybean meal exports representing 33.6% ($3.8 billion) of 2014 Iowa total exports. Iowa pork and corn exports reached a value of $2.3 billion and $1.7 billion, respectively. Feeds and other feed grains and beef and veal represented 12% and 3.6% correspondingly (see Figure 1).
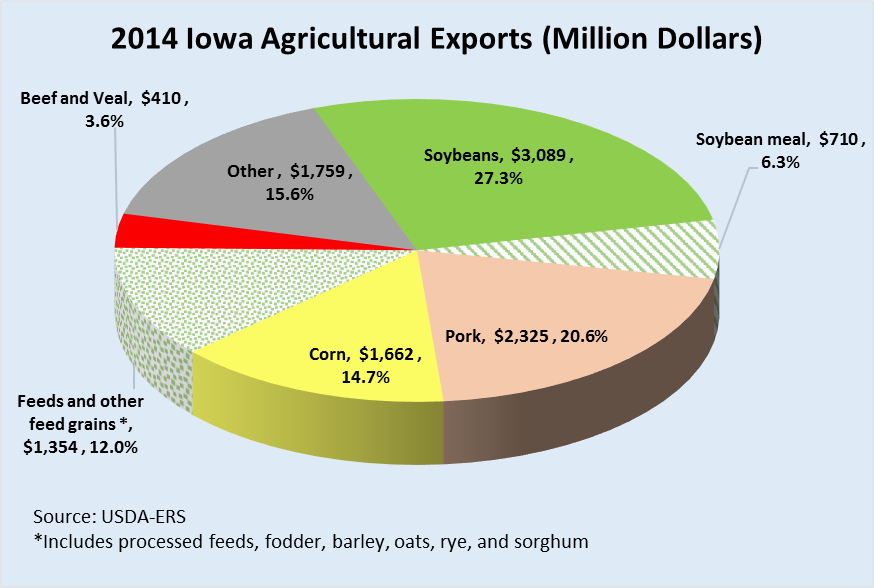
Figure 1. 2014 Iowa Agricultural Exports (Million Dollars)
As indicated by USDA-FAS, some of the TPP benefits for Iowa producers include:
Soybeans
Because soybean tariffs are already low in TPP markets, Iowa soybean producers will benefit from TPP mainly from the expected new feed demand created by lowered meat tariff (i.e., expanded U.S. meat exports will boost U.S. animal production, raising animal feed consumption).
Tariffs for soybean oil and soybean meal will be removed by Japan, Malaysia, and Vietnam. New Zealand will keep tariffs at 0% on soybeans and soybean products, while Brunei will immediately remove all tariffs.
U.S. soybean exports to the region, with sales of $3.0 billion in 2015 (see Table 1), will have a competitive advantage over our main competitors (Brazil and Argentina) if TPP is ratified. Also, since China and India have ratified preferential FTAs with some of the TPP countries, TPP will allow U.S. soybeans and soybean meal exports to stay competitive in the region.
Corn
Similar to soybeans, corn tariffs are already low in TPP markets. The U.S. corn exports to the region were valued at $4.9 billion in 2015, representing 59% of the U.S. total corn exports during last year (see Table 1).
Iowa corn producers are expected to benefit from reduced meat tariffs that are anticipated to expand feed demand. Corn tariffs will be removed within five years by Malaysia and Vietnam. New Zealand and Brunei will immediately remove all tariffs on corn and corn products.
U.S. corn exports face tough competition in the TPP markets without the TPP agreement. Japan already gives preferential tariffs to corn products imported from Australia, Chile, and Vietnam, as Japan already has FTAs with those countries. Also, due to the ASEAN-Australia-New Zealand FTA, Vietnam already confers preferential tariff treatment to corn and corn products imported from those countries. Once the EU finalizes its trade negotiations with Japan and Vietnam, EU corn product export tariffs might be lower than tariffs currently facing the U.S.
Pork
Japan is the leading value destination for U.S. pork with sales of $1.5 billion in 2015 (see Table 1).
Japan’s “Gate Price” system has a minimum import price in which importers have to pay the difference between the standard price established in Japan’s tariff schedule and the value/kilogram of a pork shipment if the imported pork is below the standard price. With the TPP, over 65% of pork and product tariff lines will be removed by Japan within a period of eleven years. The country will eliminate duties on almost 80% of tariff lines including processed pork within 16 years. The Gate Price system will be substantially modified since Japan will cut the remaining tariffs.
Malaysia will keep most tariffs at 0% on pork and pork products. Vietnam on the other hand, will eliminate tariffs on pork and pork products in five to ten years. Vietnam tariffs on pork and products are currently as high as 30%, and as a large pork consumer, under TPP U.S. pork exports to Vietnam have the potential to considerably expand.
U.S. pork exports to the TPP region face a competitive disadvantage if TPP is not ratified. Vietnam already gives preferential tariff treatment to pork imports from Australia, New Zealand, and the ASEAN countries through the ASEAN-Australia-New Zealand FTA. Once Japan and the European Union (EU) finalize their trade negotiations, EU pork will most likely have lower tariffs than the U.S. currently has.
Beef and Veal
Japan is the top value market for U.S. beef and beef products, with exports totaling $1.0 billion in 2015. Japan’s beef tariff will be lowered to 9% compared with as high as 50%, Japan’s current beef tariff. Within a 16 year period, Japan will remove duties on 74% of tariff lines including processed beef products.
Vietnam will eliminate tariffs on beef and beef products, presently as high as 34%, in a period of three to eight years, while Malaysia will hold them at 0%. All of New Zealand’s tariffs on beef and beef products, presently as high as 5%, will be removed immediately. Brunei is expected to remove all tariffs on beef and beef products.
U.S. Tariffs on Soybeans, Pork, Corn, and Beef under TPP
In 2015 the U.S. was a net exporter of agricultural products to the rest of world with an agricultural trade surplus of $19.3 billion ($133.0 billion exports minus $113.7 billion imports, see Table 1 and Table 2); however, in 2015 the U.S. had a $1 billion ($57.2 billion exports minus $58.2 billion imports, see Table 1 and Table 2) agricultural trade deficit with the TPP region. At the same time, the U.S. had a positive trade balance with the TPP region for particular agricultural commodities such as corn, soybeans, and pork, with trade surpluses of $4.8 billion, $2.8 billion, and $2.3 billion, respectively.
A strong U.S. dollar and reduced global demand for U.S. beef had a negative impact on U.S. beef exports in 2015. Last year, the U.S. experienced a beef trade deficit of $1.2 billion with the rest of the world and a $3.0 billion beef trade deficit with the TPP region (see Table 1 and Table 2), since 88% or $5.8 billion (see Table 2) of U.S. total beef imports were shipped from that region, particularly from Australia ($2.5 billion), New Zealand ($1.2 billion), Canada ($1.1 billion), and Mexico ($1.0 billion).
Sixty nine percent of U.S. total pork imports ($1.7 billion) in 2015 came the TPP region, with 1.1 billion coming from Canada.
Overall, 51% ($58.2 billion) of U.S. total agricultural import ($113.7 billion) were shipped from the TPP region, mainly from Canada ($21.7 billion) and Mexico ($21.0 billion), two countries with which the U.S. already has a FTA.
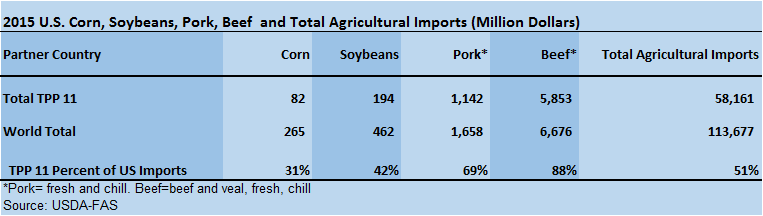
Table 2. U.S. Corn, Soybeans, Pork, Beef, and Total Agricultural Imports (Million Dollars)
Based on USDA-FAS information, this is what is expected for the U.S.’s tariffs for soybeans, pork, corn, and beef under TPP:
Soybeans:
Tariffs on soybean products will be eliminated within ten years. Presently, those tariffs are as high as 19.1%. Soybeans imported into the U.S. are currently duty-free.
Corn:
The U.S. will remove tariffs on corn and corn products within five years. Currently tariffs on corn and corn products are as high as 3.4%.
Pork:
U.S.’s tariffs on pork and pork products will be eliminated within 10 years. Currently these tariffs are as high as 6.4%.
Beef:
The U.S.’s tariffs on beef and beef products, now as high as 26.4%, will be removed in 15 years.
The TPP agreement is expected to benefit U.S. agriculture including Iowa’s key agricultural commodities (i.e., soybeans, pork, corn, and beef) by reducing or eliminating tariffs and creating new tariff rate quotas that would stimulate demand for U.S. agricultural products in the TPP region. The TPP has the potential to keep U.S. agricultural products competitive in the region, which could support stronger commodity prices and farm income growth.
- corn
- iowa
- pork exports
- trade