posted by David Miller on Wednesday, May 12, 2021
President Biden recently pledged that the U.S. would cut greenhouse gas (GHG) emissions by 50% by the end of the current decade. It is not clear exactly what agriculture’s contribution to a national reduction goal would be as that has not been spelled out by any administration officials. However, what is often cited as ways for agriculture to reduce emissions are: improved land and crop management, especially achieving greater fertilizer efficiency and draining water from wetland rice fields; adjusting feeding practices for ruminants to reduce enteric fermentation and releases of methane; and capturing methane from manure storage for renewable energy production.
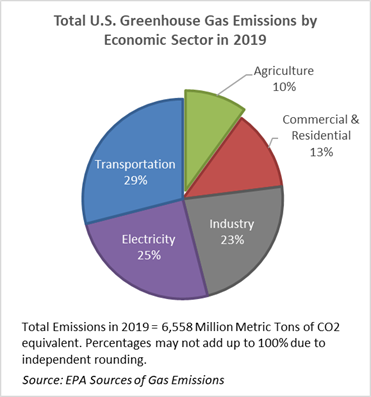
According to the EPA, U.S. agriculture produces 10% of U.S. greenhouse gas emissions which is about 700 million metric tons of CO2 equivalent. Nitrous oxide and carbon dioxide emissions from soil management activities (tillage, fertilization, etc.) account for just over 50% of U.S. agriculture’s emissions. Another quarter of the emissions result from methane emissions from ruminant livestock respiration and 12% from releases of methane and nitrous oxide from manure storage.
Total GHG emissions from U.S. agriculture have increased by 12% since 1990 with nearly all of the growth occurring after 2012. EPA data show that the drivers of the increase are increased nitrous oxide emissions from soils fertility management and increases in emissions from livestock manure management systems, especially the emission-intensive liquid systems.
This being said, the measured increase in total GHG emissions doesn’t reflect the often overlooked progress that is being made by agriculture in many areas. One particularly important measure of this progress is the efficiency of input use in crop production. The fertilizer of most interest from a GHG and crop production perspective is annual nitrogen fertilizer applied to crops due to the potential release of nitrous oxide from inefficient N application.
While total emission may be increasing as total output of crops increases, the nitrogen use efficiency in the four largest U.S. field crops has improved since 1990 and continues to improve. The four graphs use USDA-NASS national annual production data (in total tons produced) and USDA data on total tons of nitrogen application per crop. As can be seen, output (tons of product) per ton of nitrogen fertilizer applied is increasing for all four crops. That means that for each ton of nitrogen fertilizer input, U.S. farmers are producing more food and fiber products.
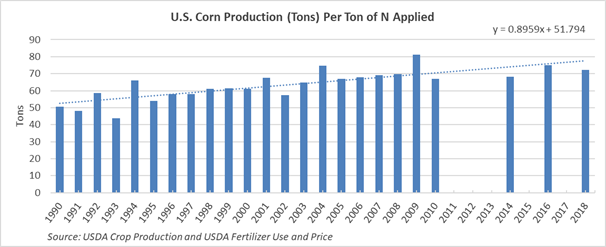
For corn, the current trend in nitrogen use efficiency is an average increase of 0.89 tons (or 32 bushels) per year per ton of N applied. If the current trend holds in the near future the U.S. will produce more than 80 tons of corn for every ton on N applied. In 1990, that same ton of N applied only produced 50 tons of corn. According to these data, corn has experienced a nearly 60% increase in N use efficiency since 1990.
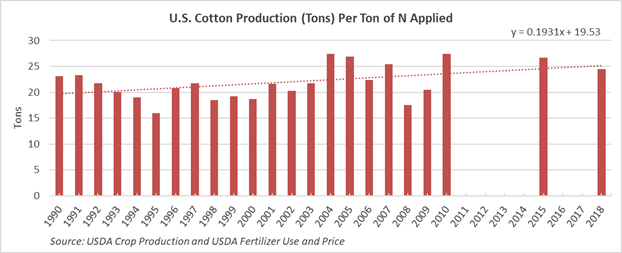
For cotton, the current trend for output of cotton and cottonseed combined is an average increase of 0.193 tons (386 combined pounds) per year for each ton of N applied. Assuming the current trend holds for the near future, U.S. cotton producers will harvest more than 25 tons of cotton and/or cottonseed for every ton of N applied. In 1990, that same ton of N applied only produced 20 tons of product. According to these data, cotton has experienced a 25% increase in N use efficiency since 1990.
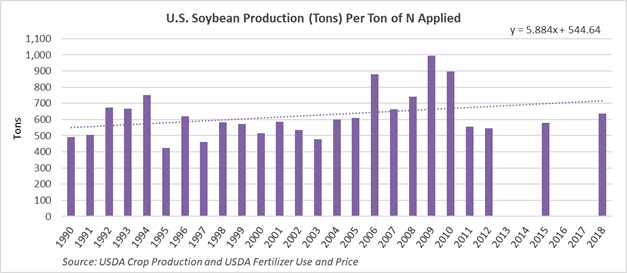
For soybeans, the current trend for production is an average increase of 5.88 tons (196 bushels) per year for each ton of N applied. Typically, not a lot of N is applied to soybeans since they have nodules that produce their own N, but to the extent that N is applied (typically in a combination with phosphate fertilizer), the rate of N-efficiency is increasing substantially. If the current trend holds for the near future, each ton of N applied will result in more than 700 tons of soybean production compared to about 550 tons of soybeans per ton of applied N in 1990. According to these data, soybeans have experienced a 22% increase in N efficiency use since 1990.
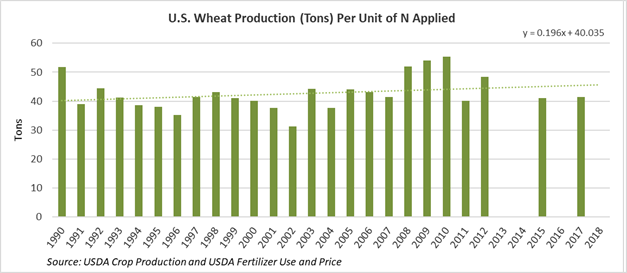
As for wheat, the current trend for production is an average increase of 0.196 tons (6.5 bushels) per year for each ton of N applied. In 1990 the U.S. was producing 40 tons of wheat per ton of N applied and now the U.S. produces 45.2 tons of wheat for each ton of N applied. According to these data, wheat has experienced a 12% increase in N use efficiency.
One of the very real questions for agricultural and food policy regarding GHG emissions is, “Do we want to cut emissions by cutting crop production and food supplies? Or should the emphasis be on continued improvements in factor use efficiency, such as improved N use efficiency in the major crops while continuing to increase overall agricultural output and increased food, feed and renewable fuel production?”
- biden
- corn
- cotton
- emissions
- epa
- soybeans
- u.s.a
- wheat